Navigating the Wazuh dashboard
Dashboards
The Wazuh dashboard is designed to provide an overview of security-related incidents and activities in your environment in real-time. The Wazuh dashboard aggregates and visualizes data from different sources, enabling administrators and security analysts to identify and respond to potential threats. It features a user-friendly interface that displays dashboards for endpoint security, threat intelligence, security operations and cloud security. It also shows the summary for the connected or disconnected Wazuh agents, and highlights the severity levels of alerts triggered within the last 24 hours.

Endpoint security
This section shows dashboards for:

Threat intelligence
This section shows dashboards for:

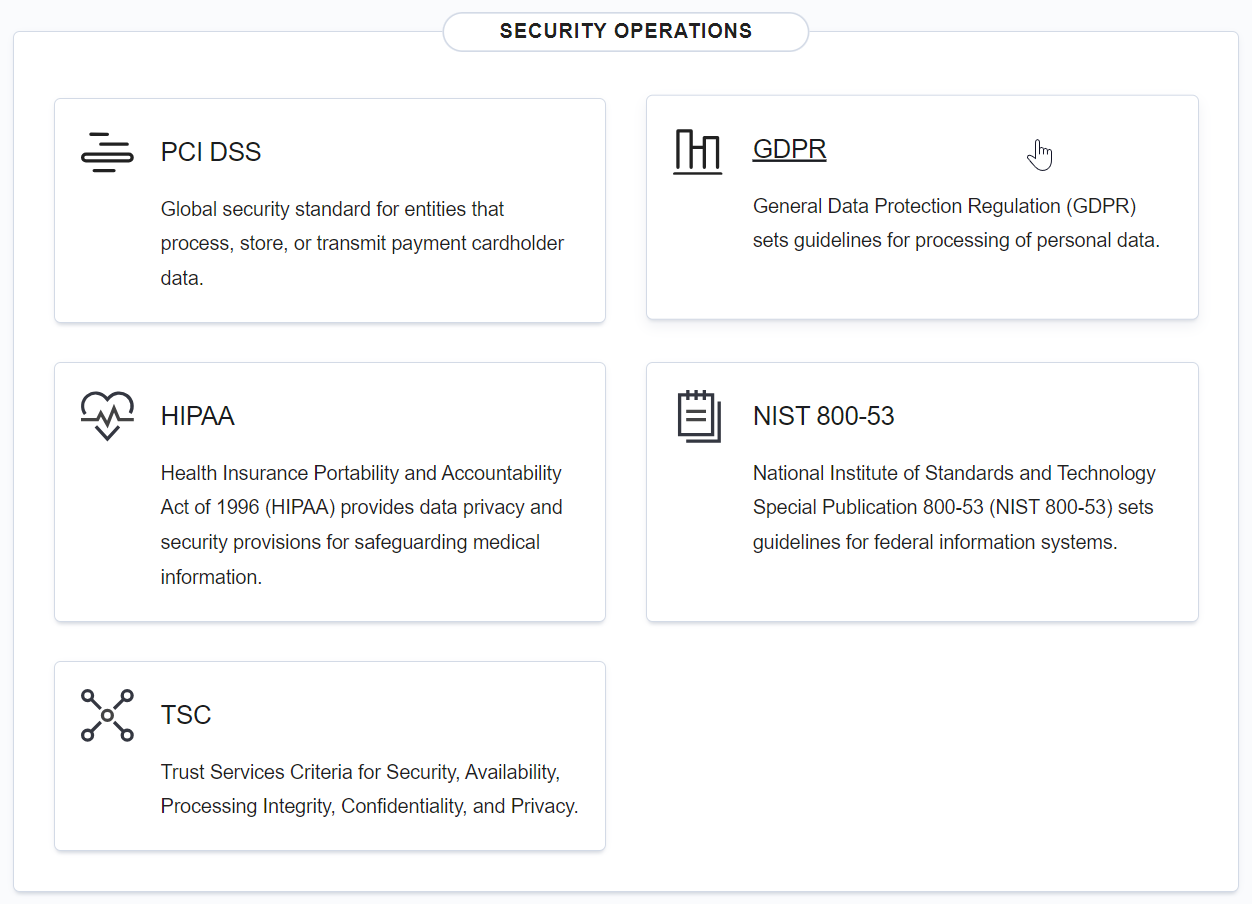
Security operations
This section shows the dashboards for regulatory standards including:
PCI DSS
GDPR
HIPAA
NIST 800-53
TSC
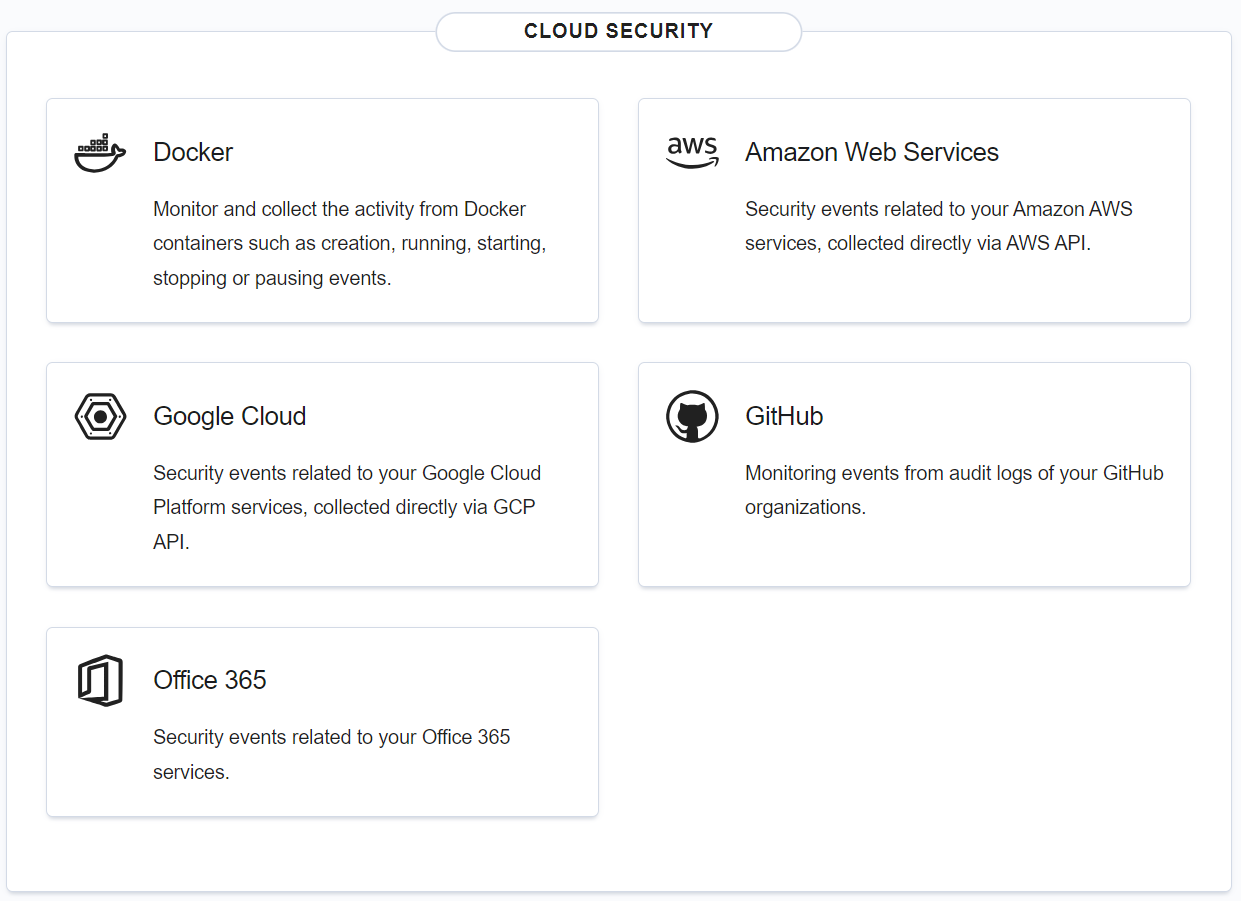
Cloud security
This section shows dashboards for:
Amazon Web Services
Google Cloud
GitHub
Office 365
Server management
Wazuh server management offers options for managing rules, decoders, CDB lists, clusters, security configurations such as user, roles, policies and more. It also includes options for managing Wazuh agents installed on monitored endpoints.

Endpoints Summary
This section shows details of monitored endpoints and options for deploying Wazuh agents.

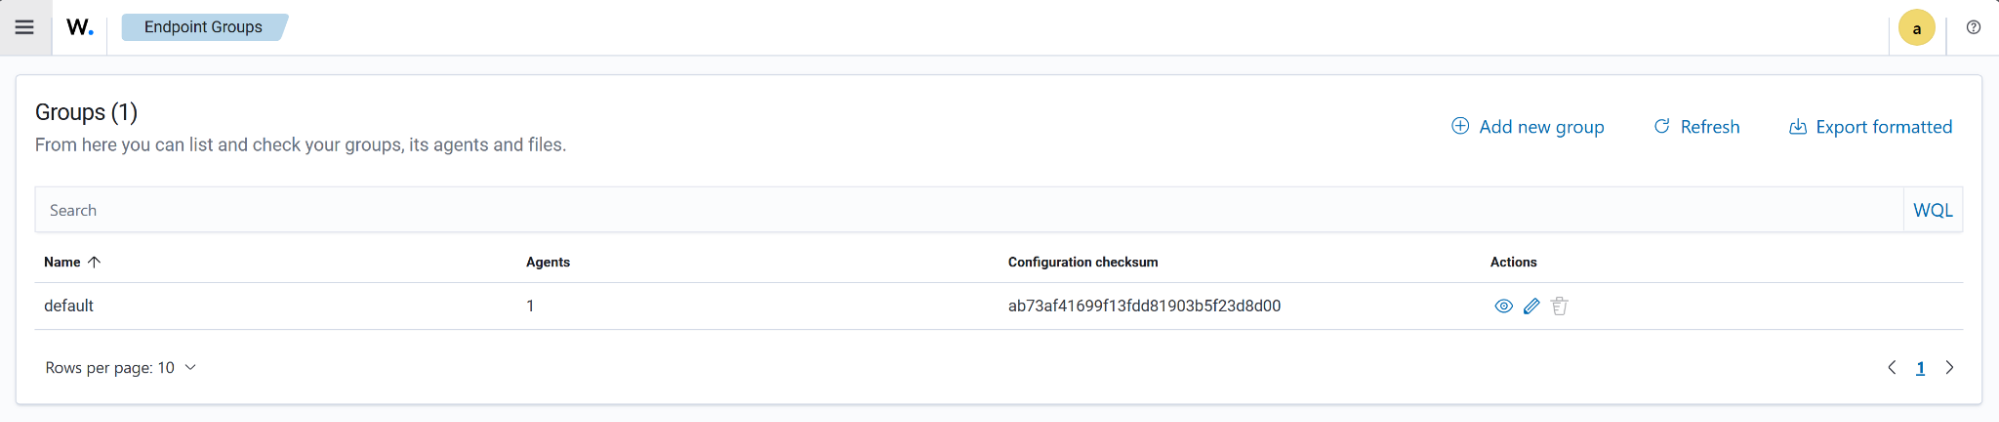
Endpoint Groups
Users can view existing groups, create new endpoint groups, and organize endpoints based on these groups.
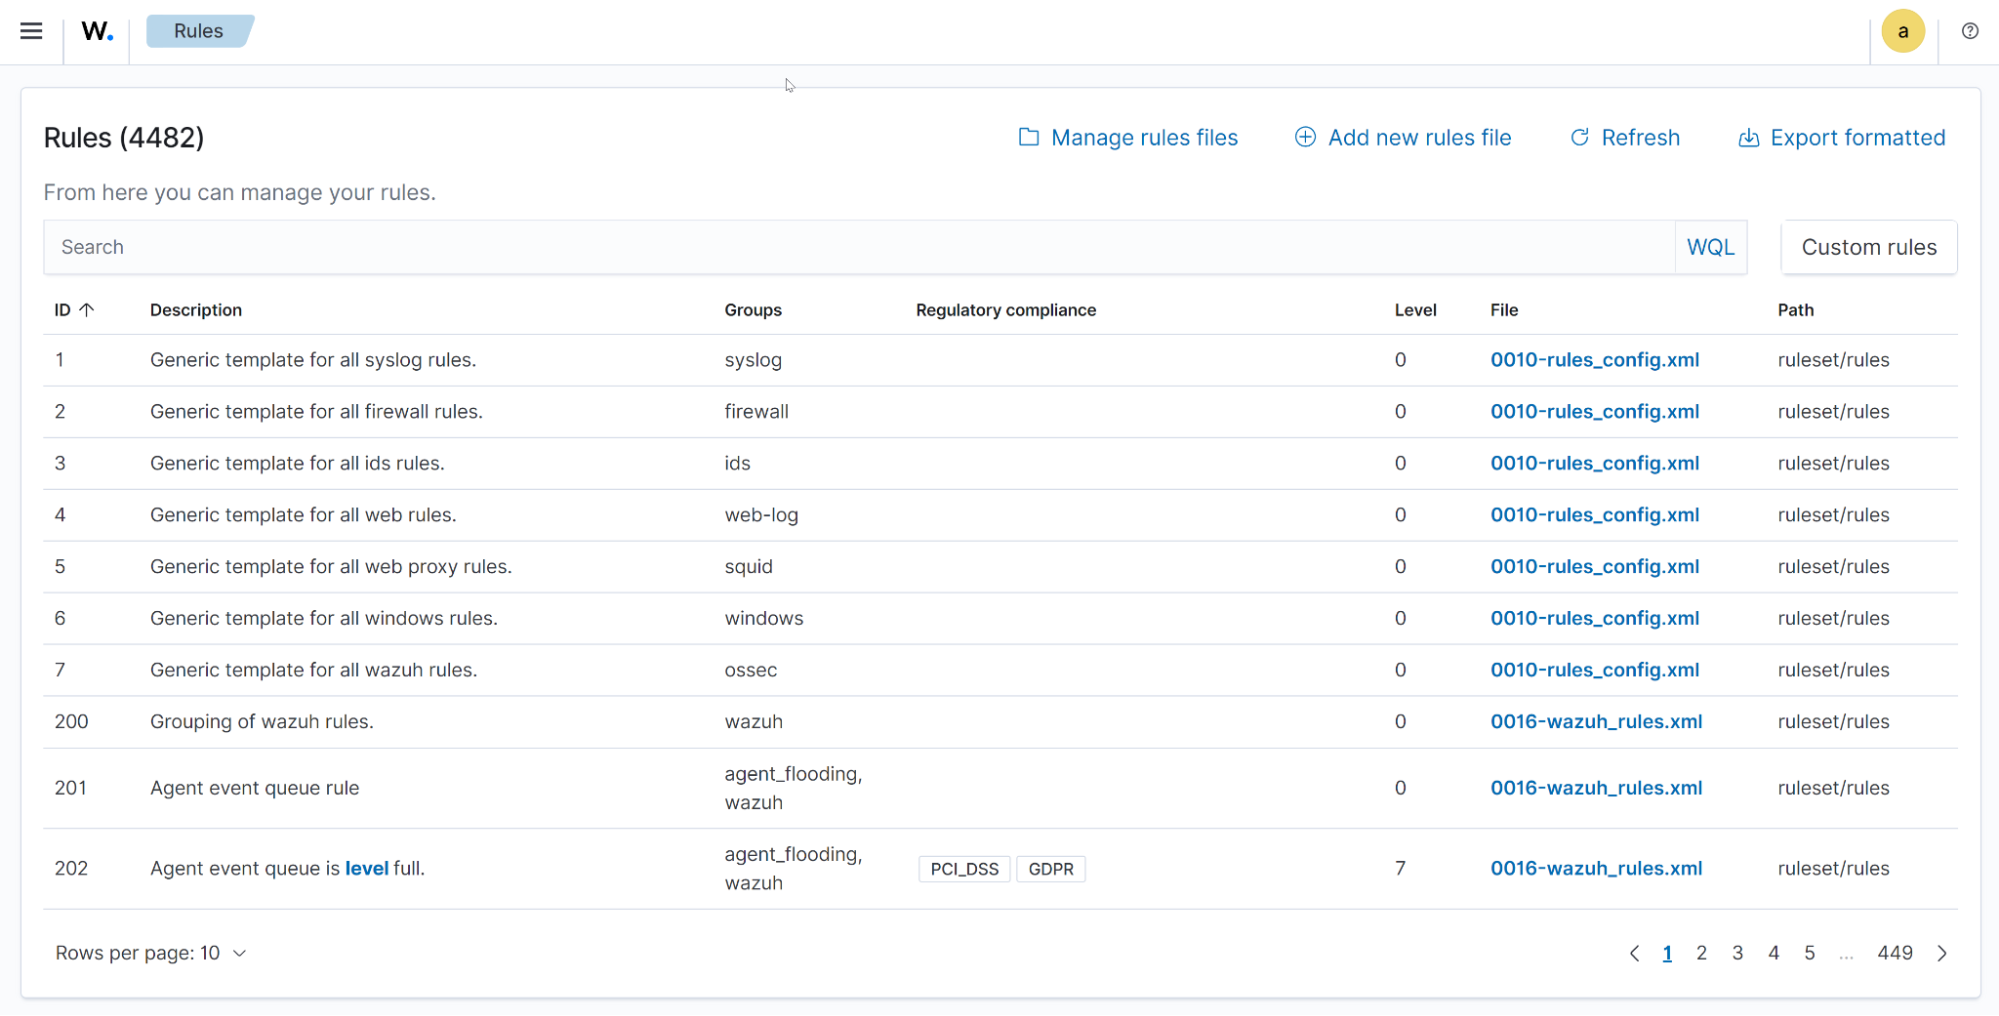
Rules
The Rules section allows users to query existing rules using Wazuh Query Language and manage custom rules.
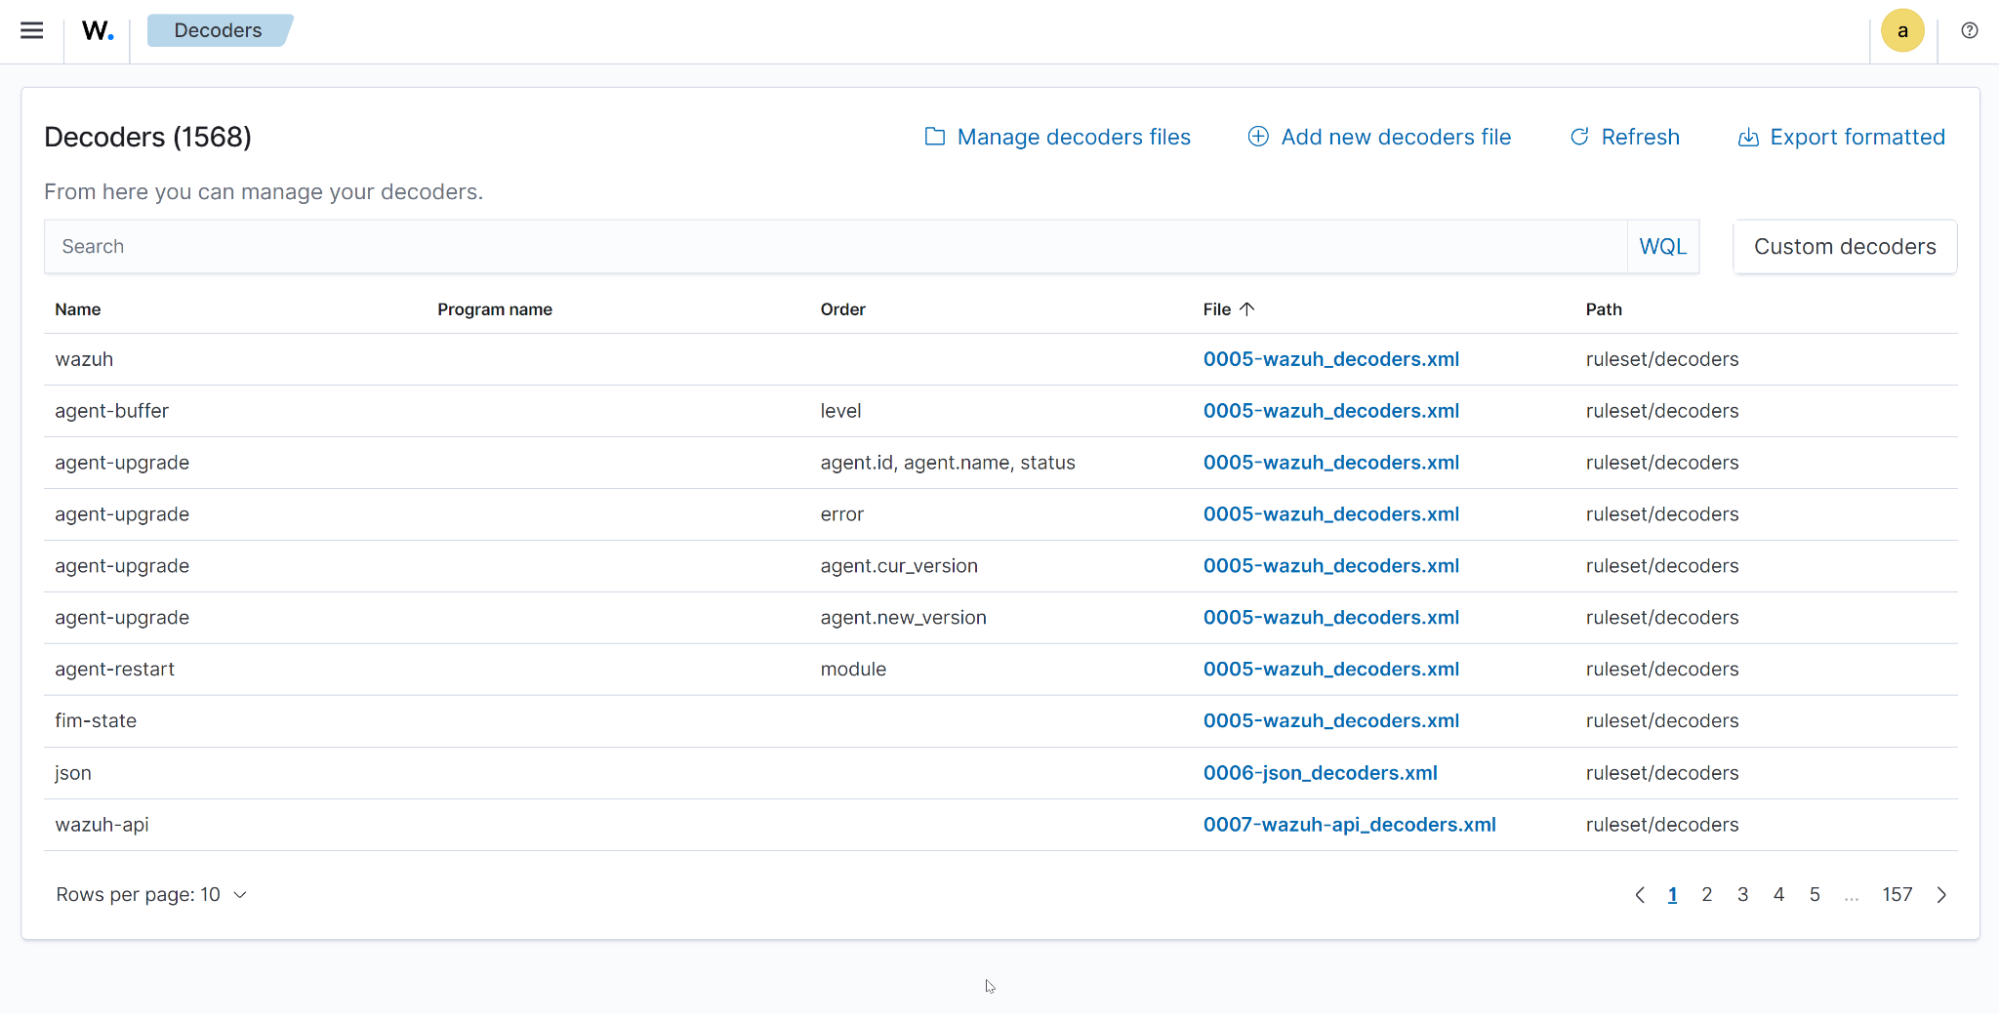
Decoders
The Decoders section allows users to query existing decoders using Wazuh Query Language and manage custom decoders.
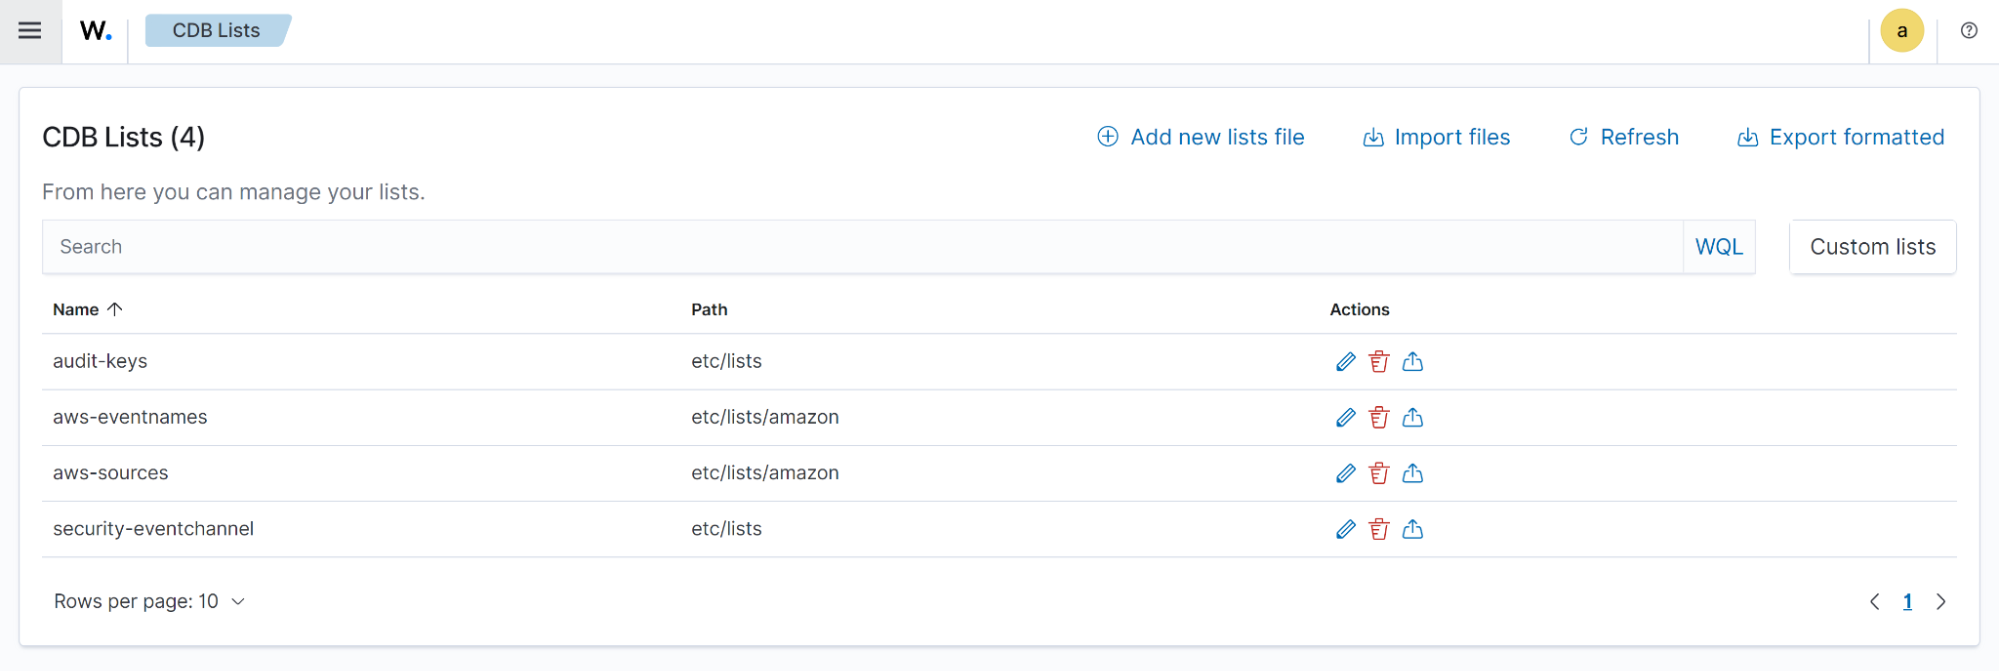
Constant Database (CDB) lists
A CDB list is a text file you can use to save a list of users, file hashes, IP addresses, and domain names. CDB lists can act as either allow or deny lists. You can learn more about CDB lists in the documentation.
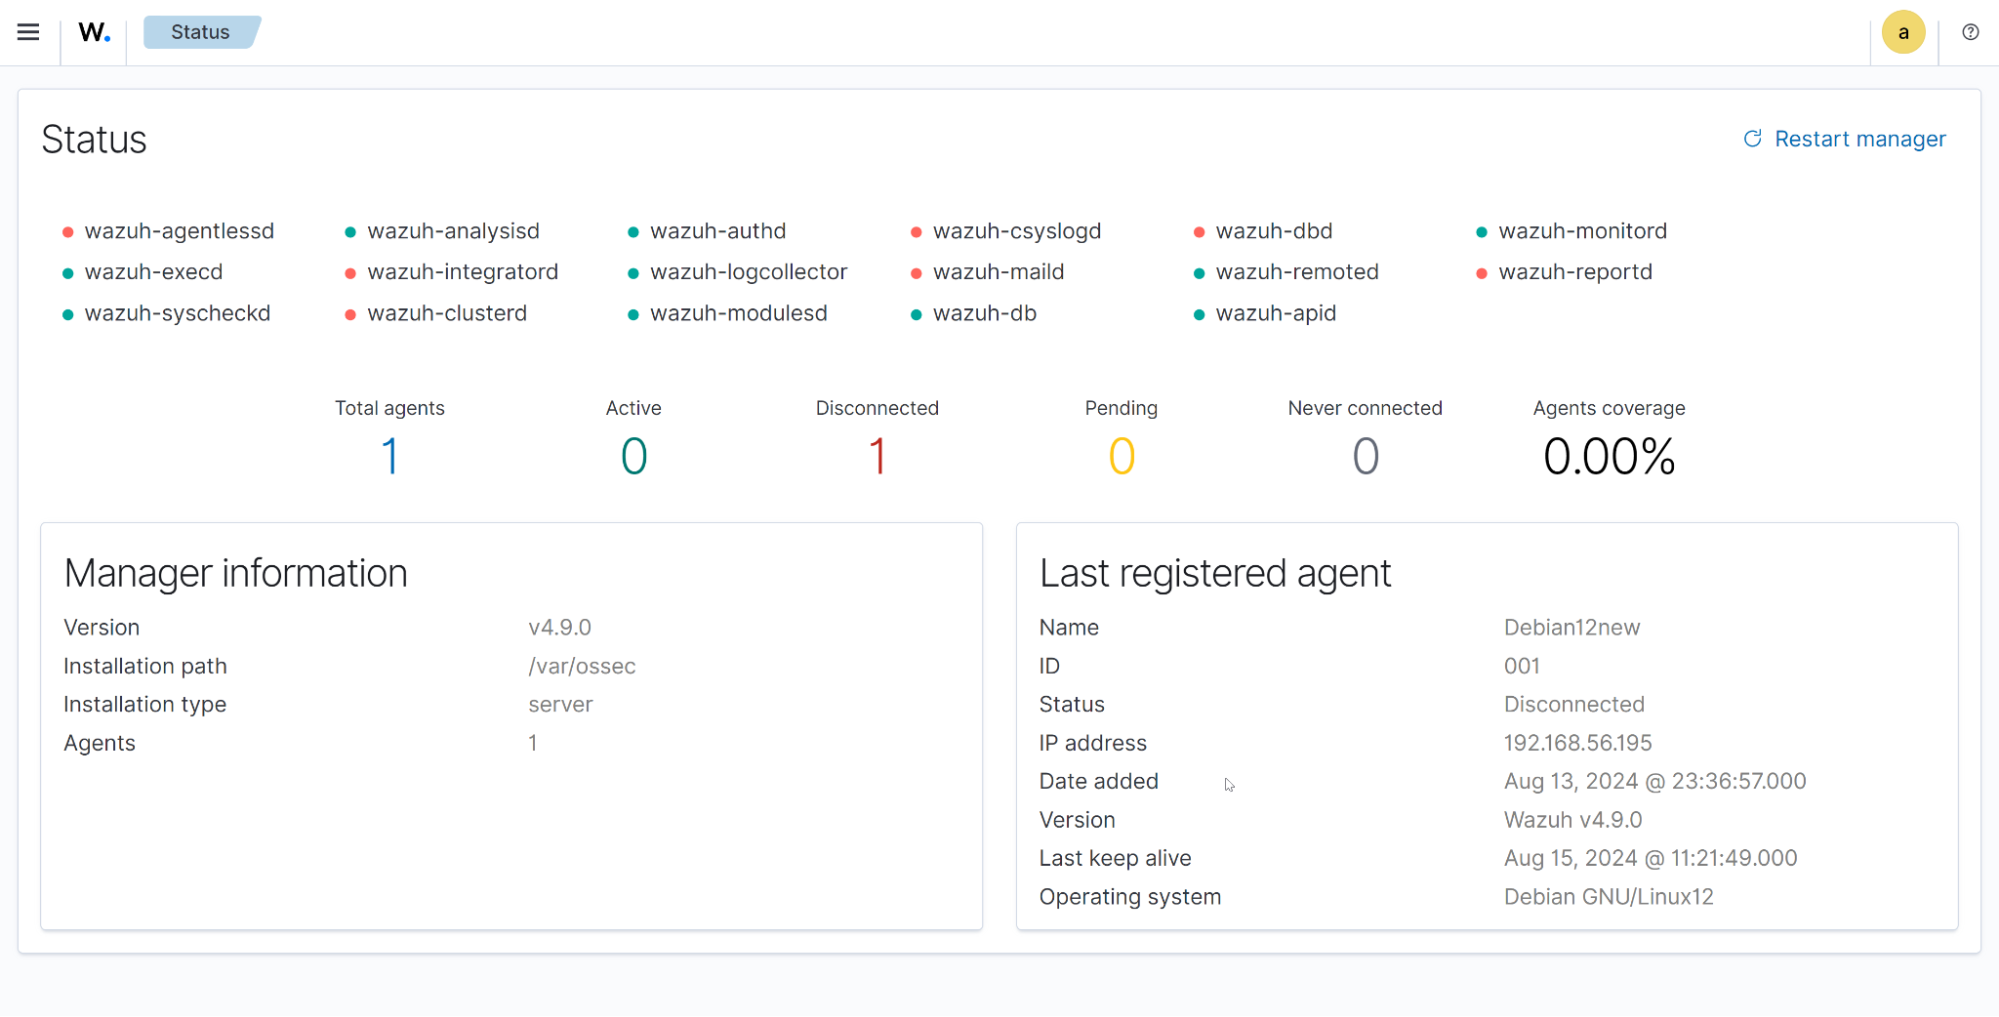
Status
Users can view the status of different Wazuh daemons, the overall Wazuh agent status, Wazuh manager information, and more.
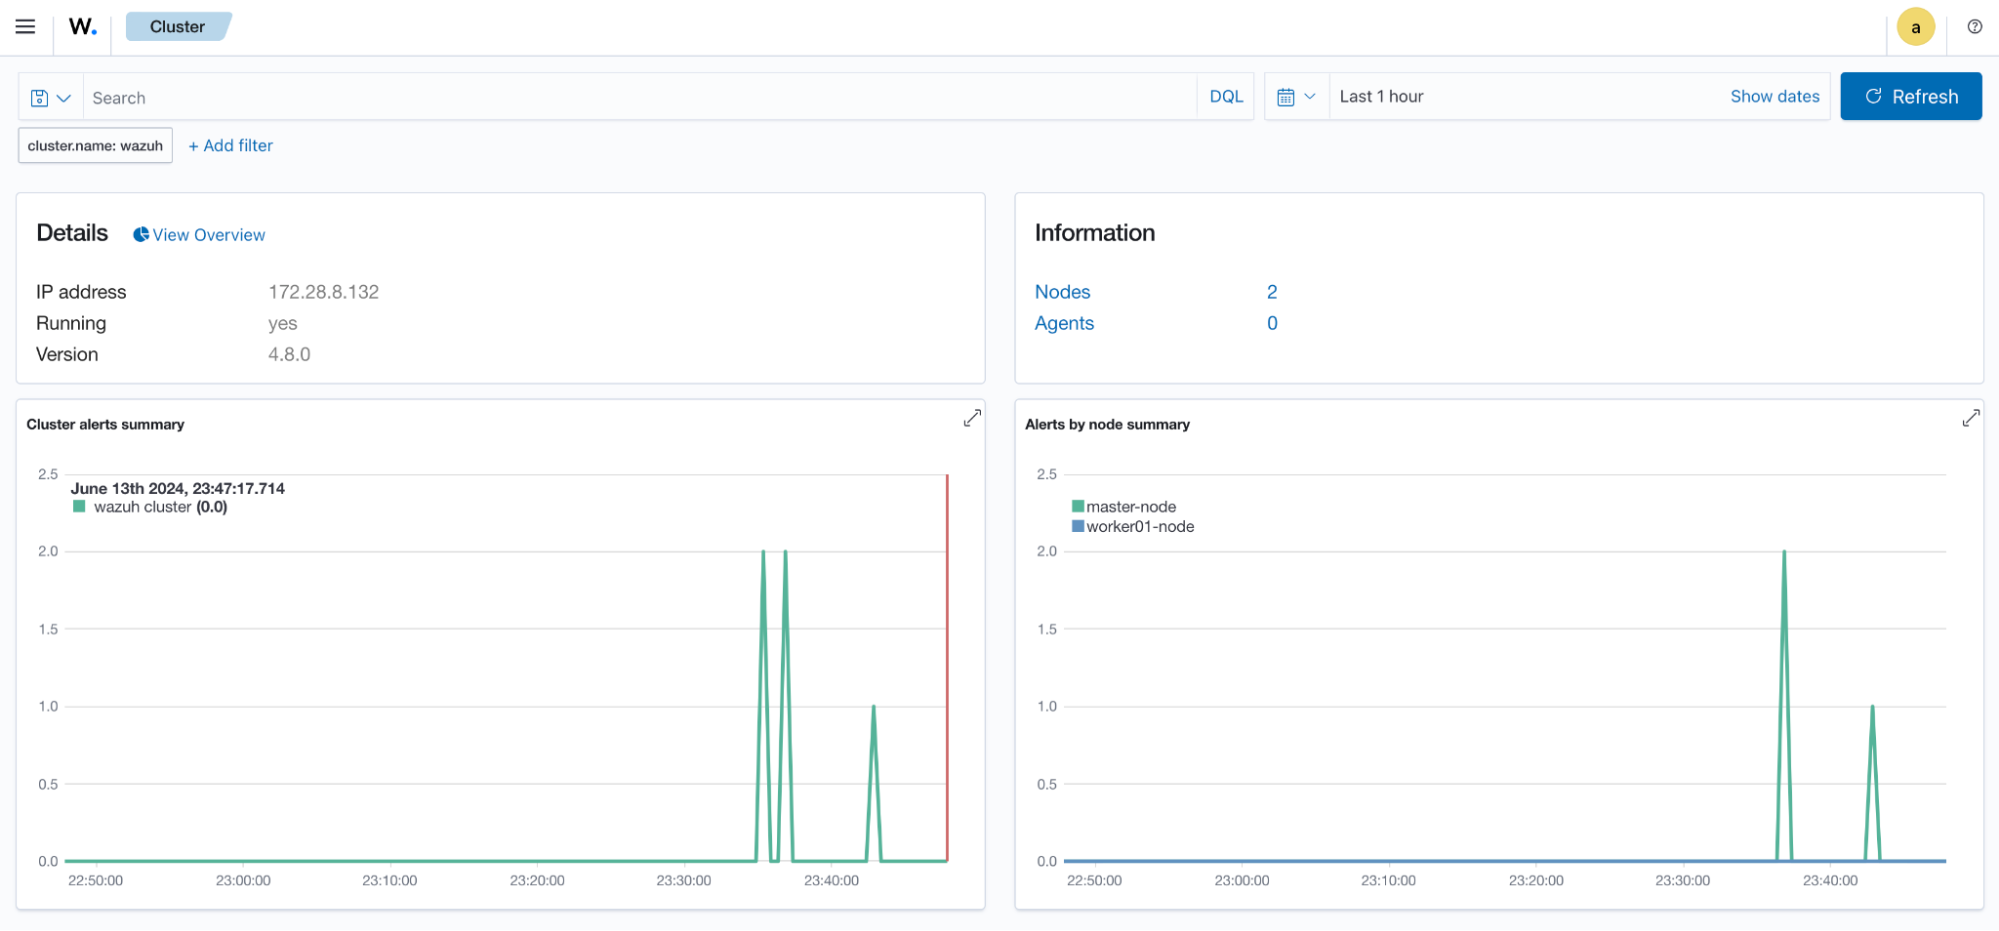
Cluster
The Cluster section shows the information about your Wazuh cluster.
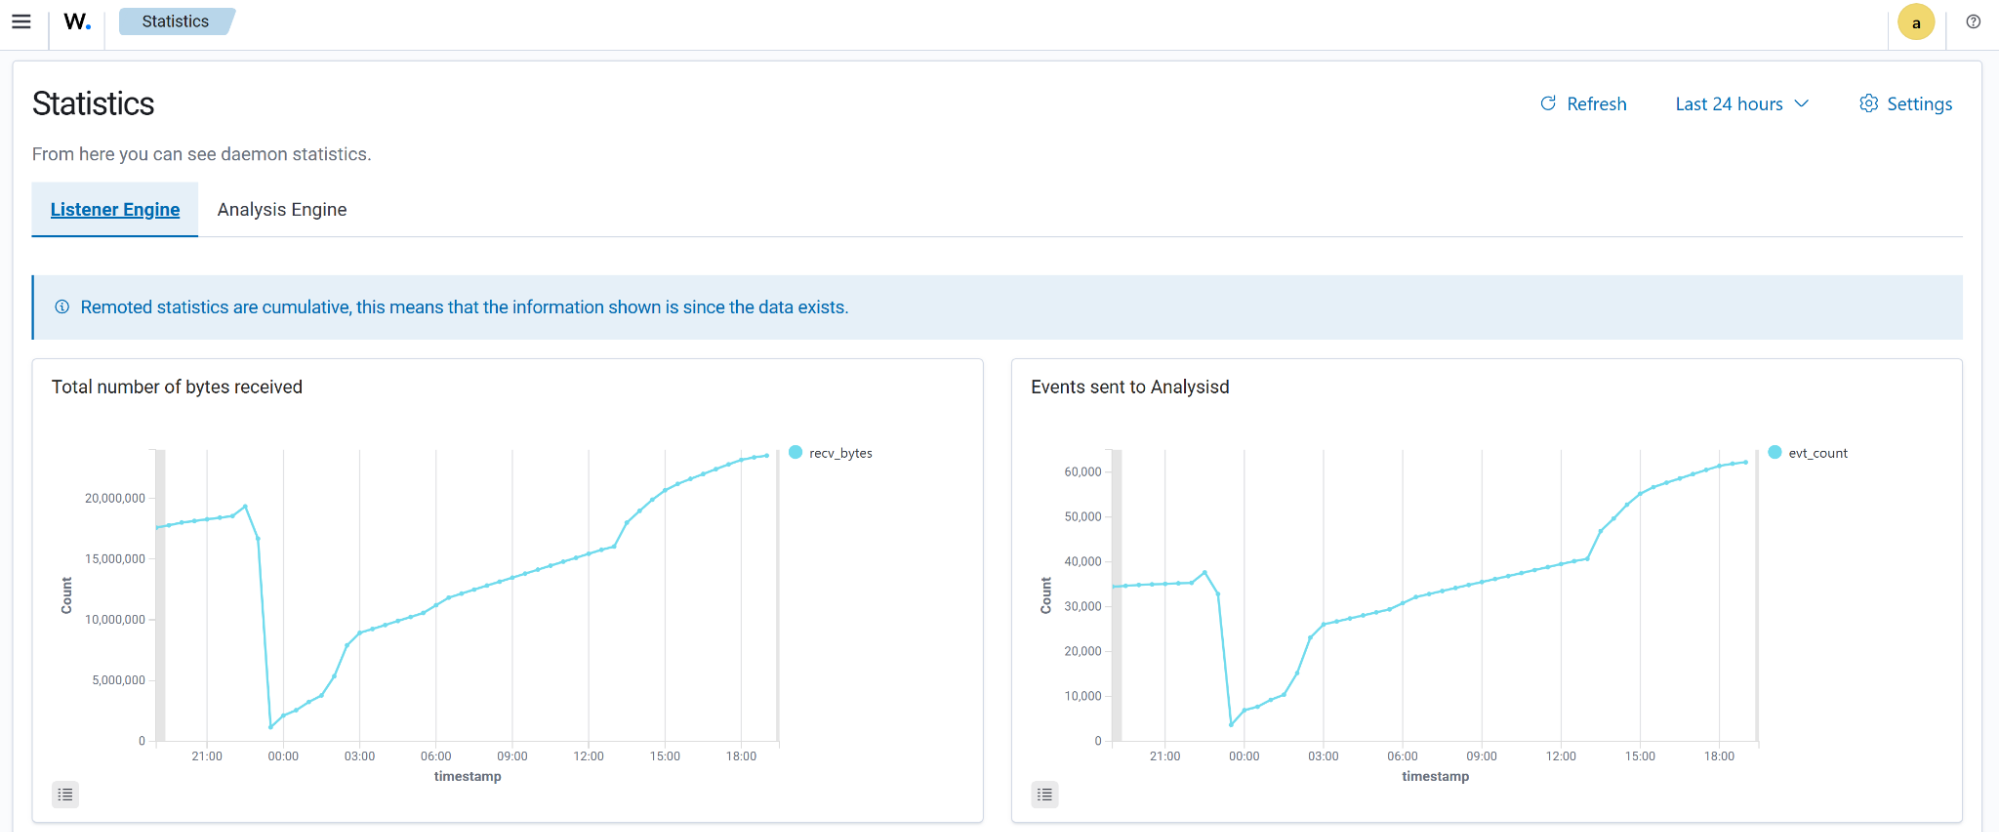
Statistics
Statistics of the Listener Engine and Analysis Engine of the Wazuh server are visible in this section.
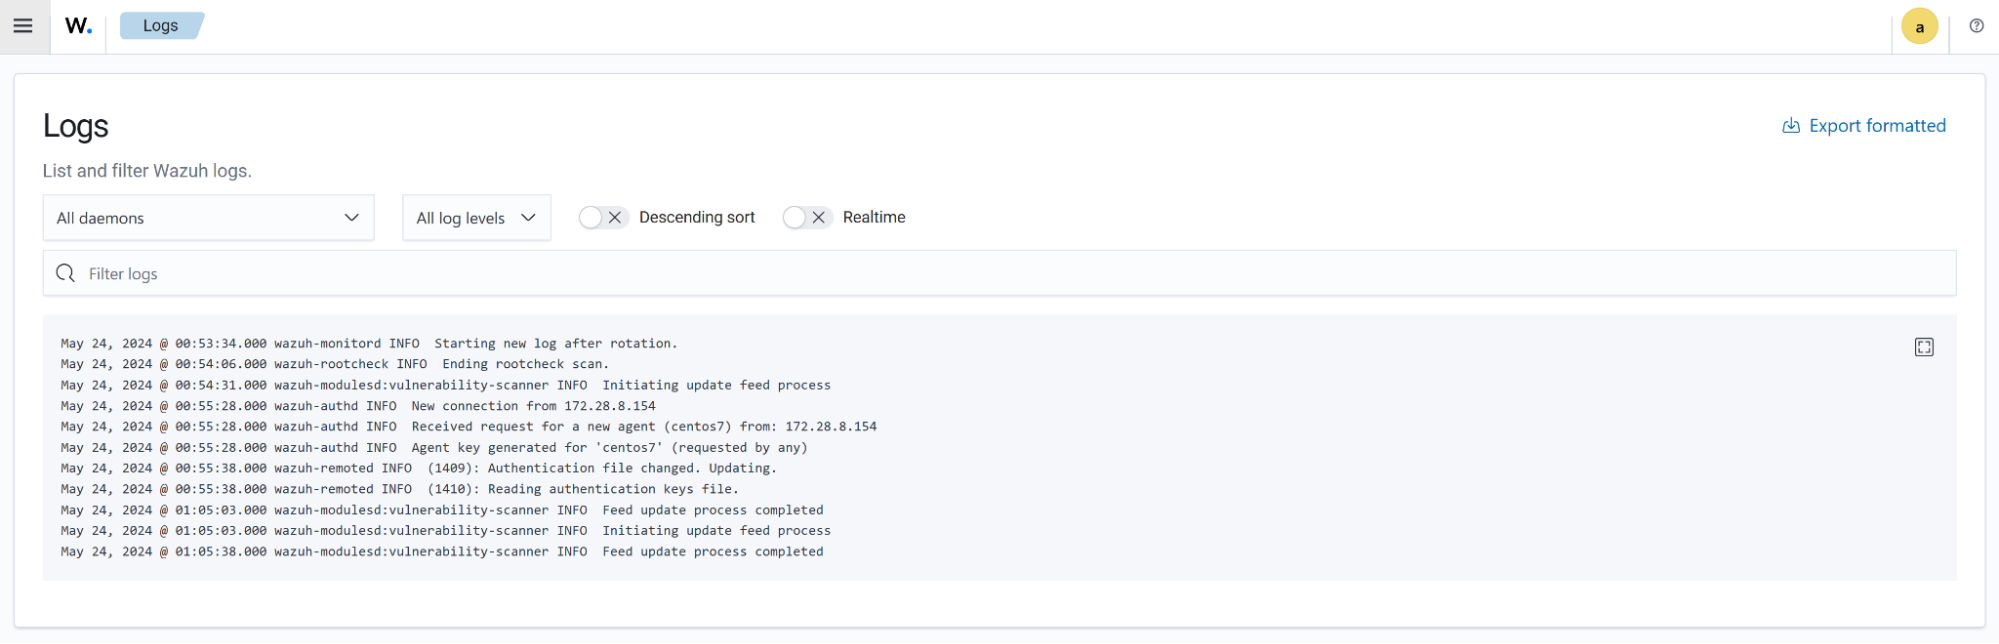
Logs
Logs stored in /var/ossec/logs/ossec.log in the Wazuh manager are shown in the section below.
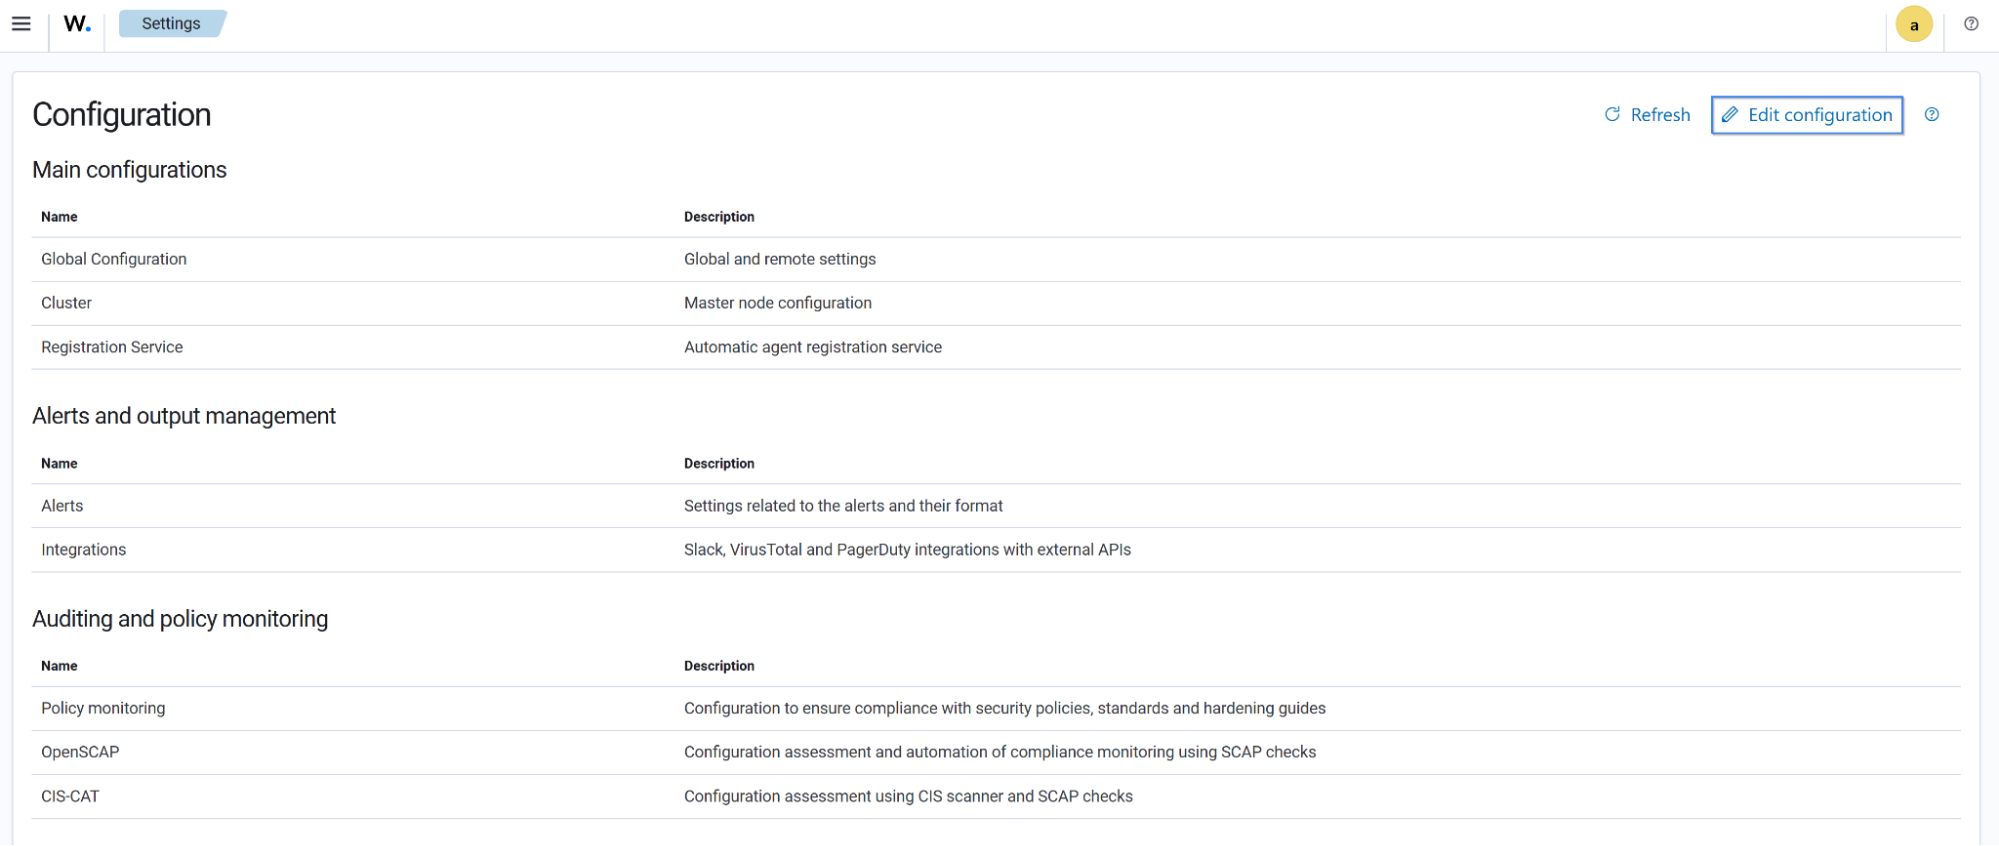
Settings
Users can modify the Wazuh server configuration file located at /var/ossec/etc/ossec.conf from the Wazuh dashboard.
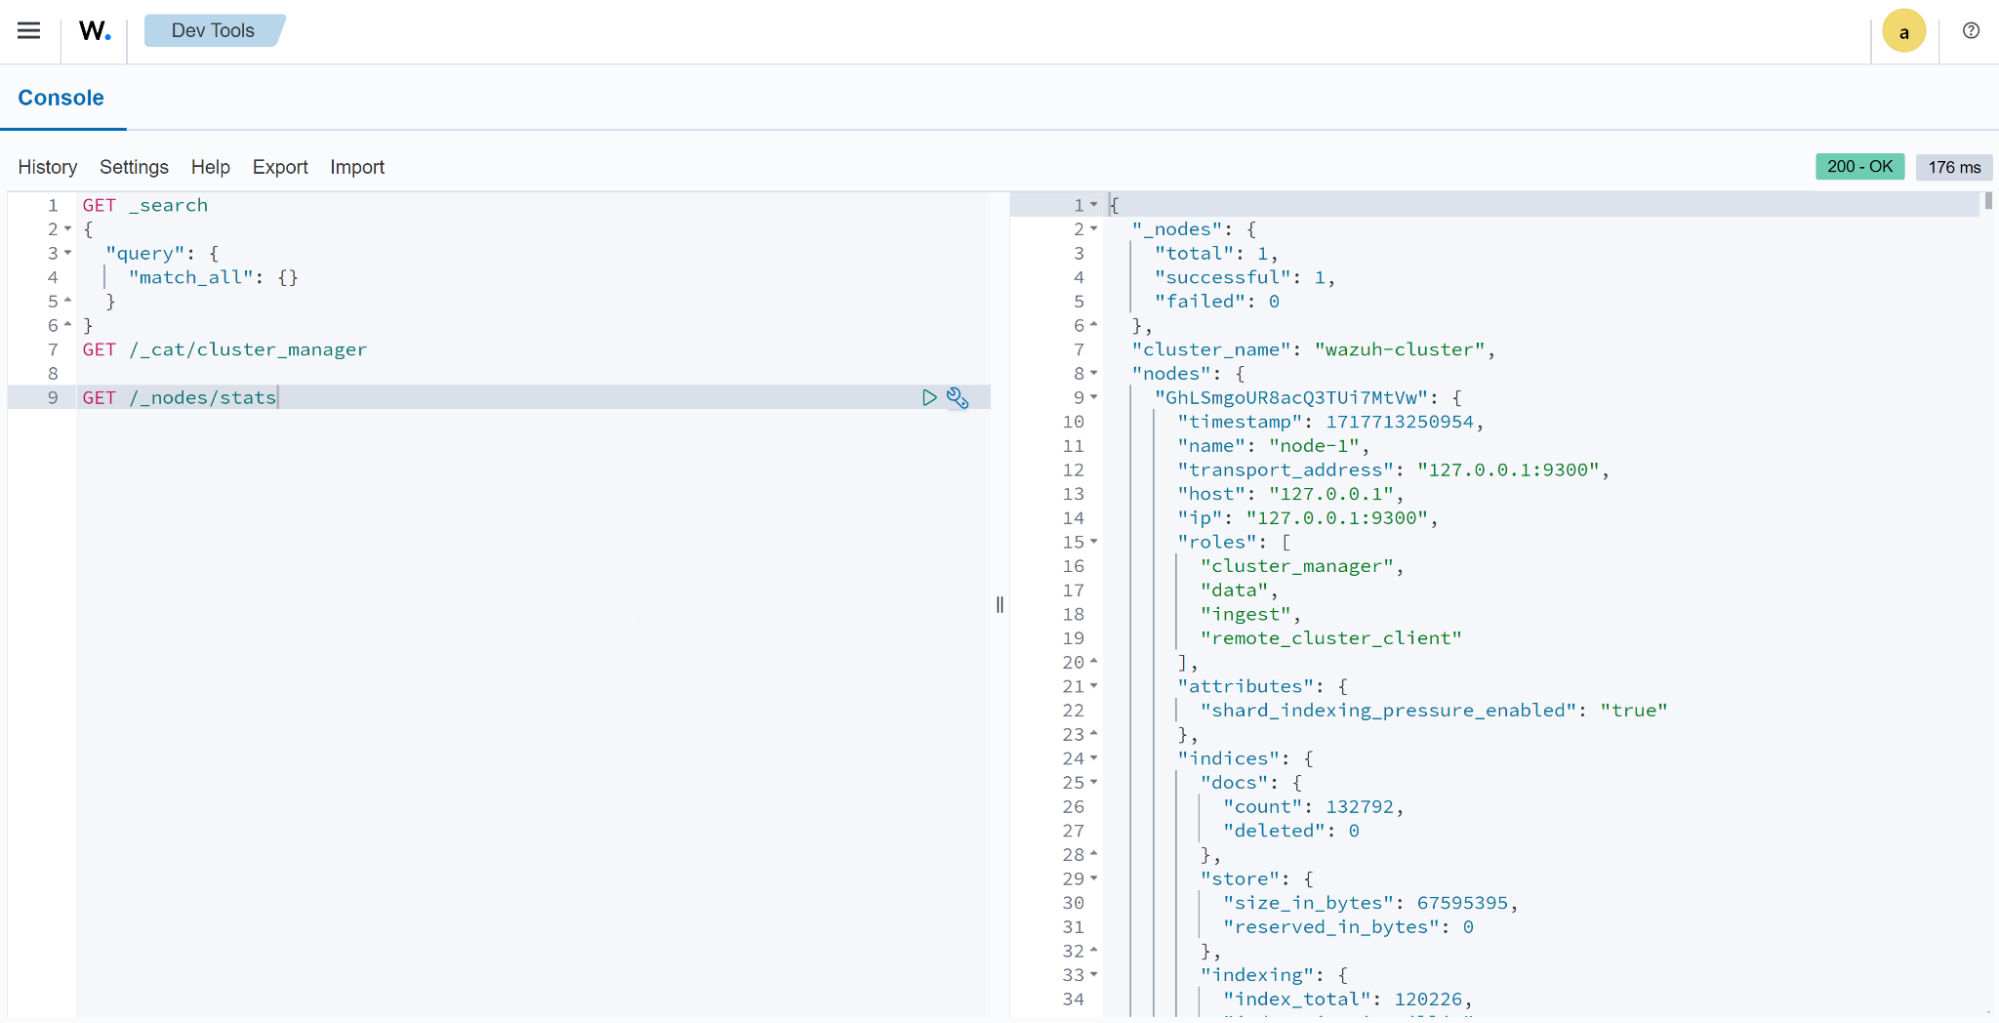
Dev Tools
Users can make API calls to extract detailed information about security events, Wazuh agents, inventory, vulnerabilities, and more.

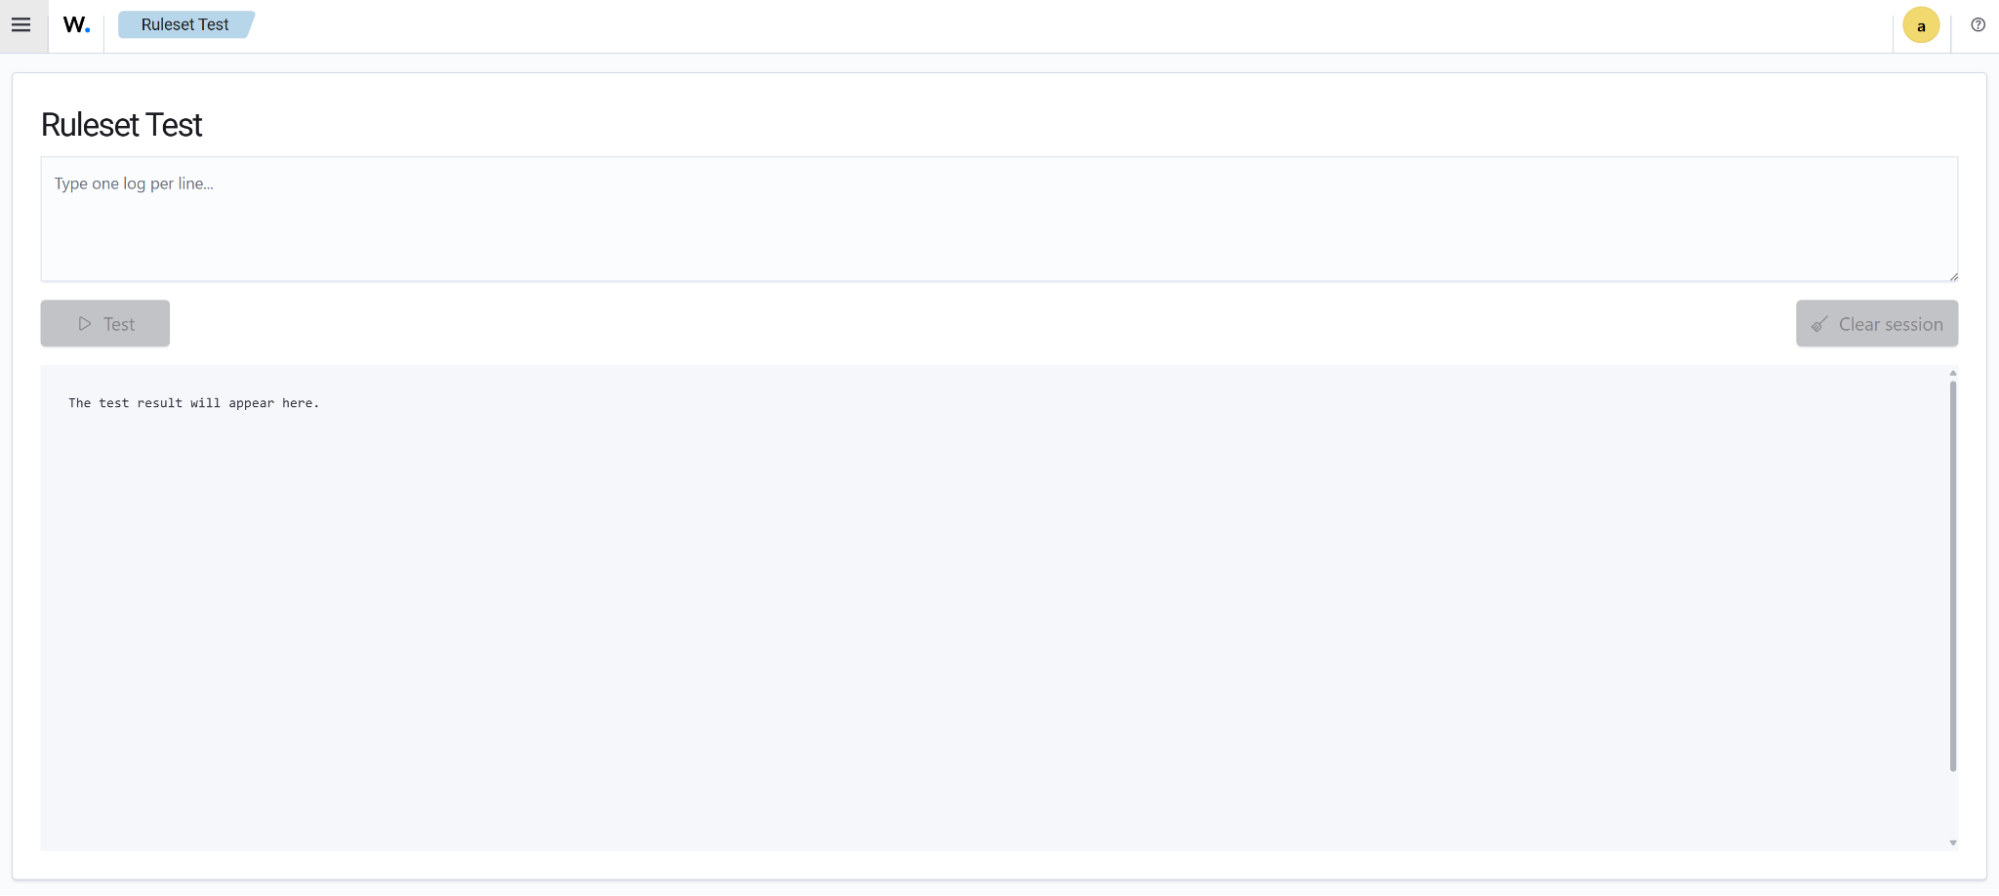
Ruleset Test
The Ruleset Test option allows users to test Wazuh rules from the Wazuh dashboard.
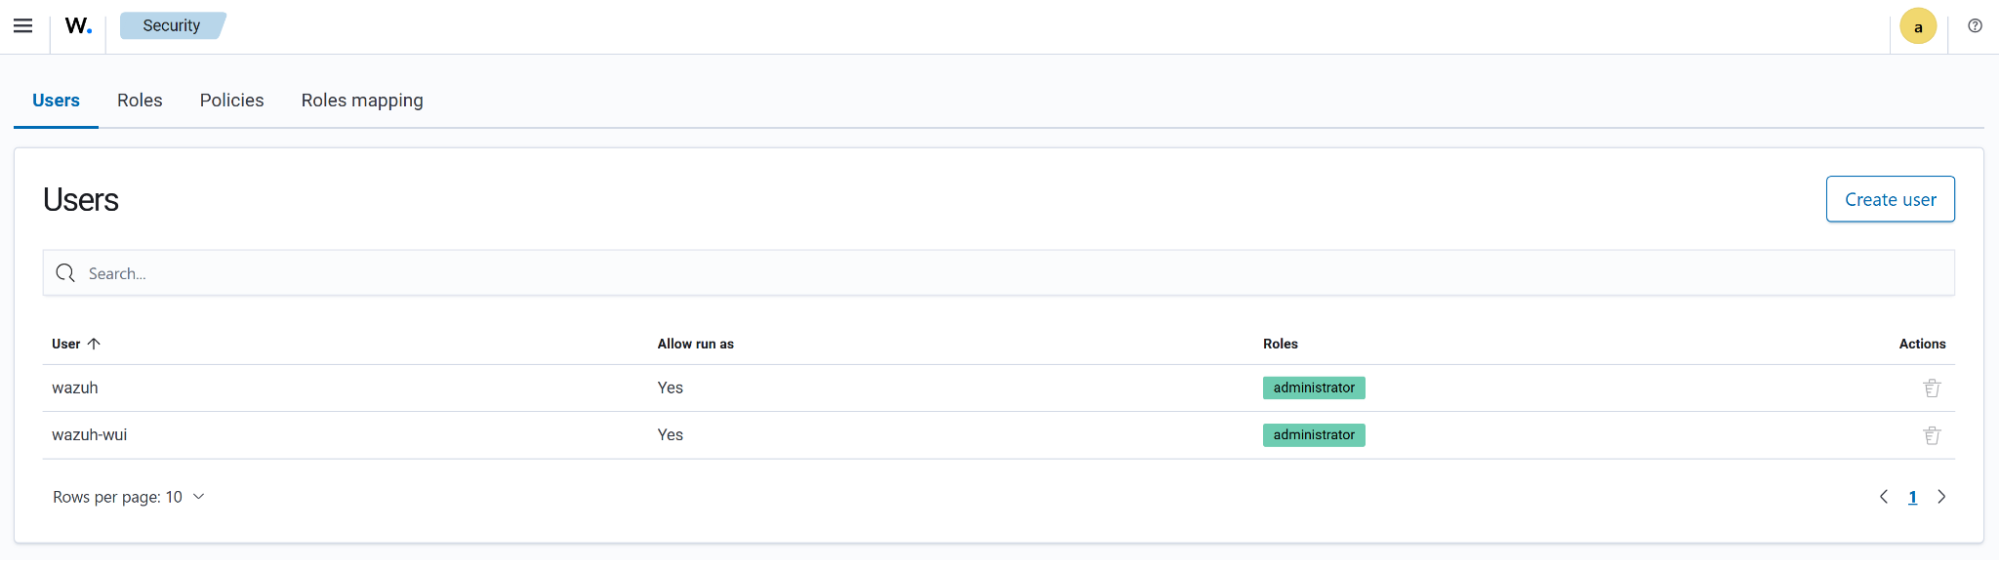
Security
This section includes the configurations for managing the internal users in Wazuh. It is available.
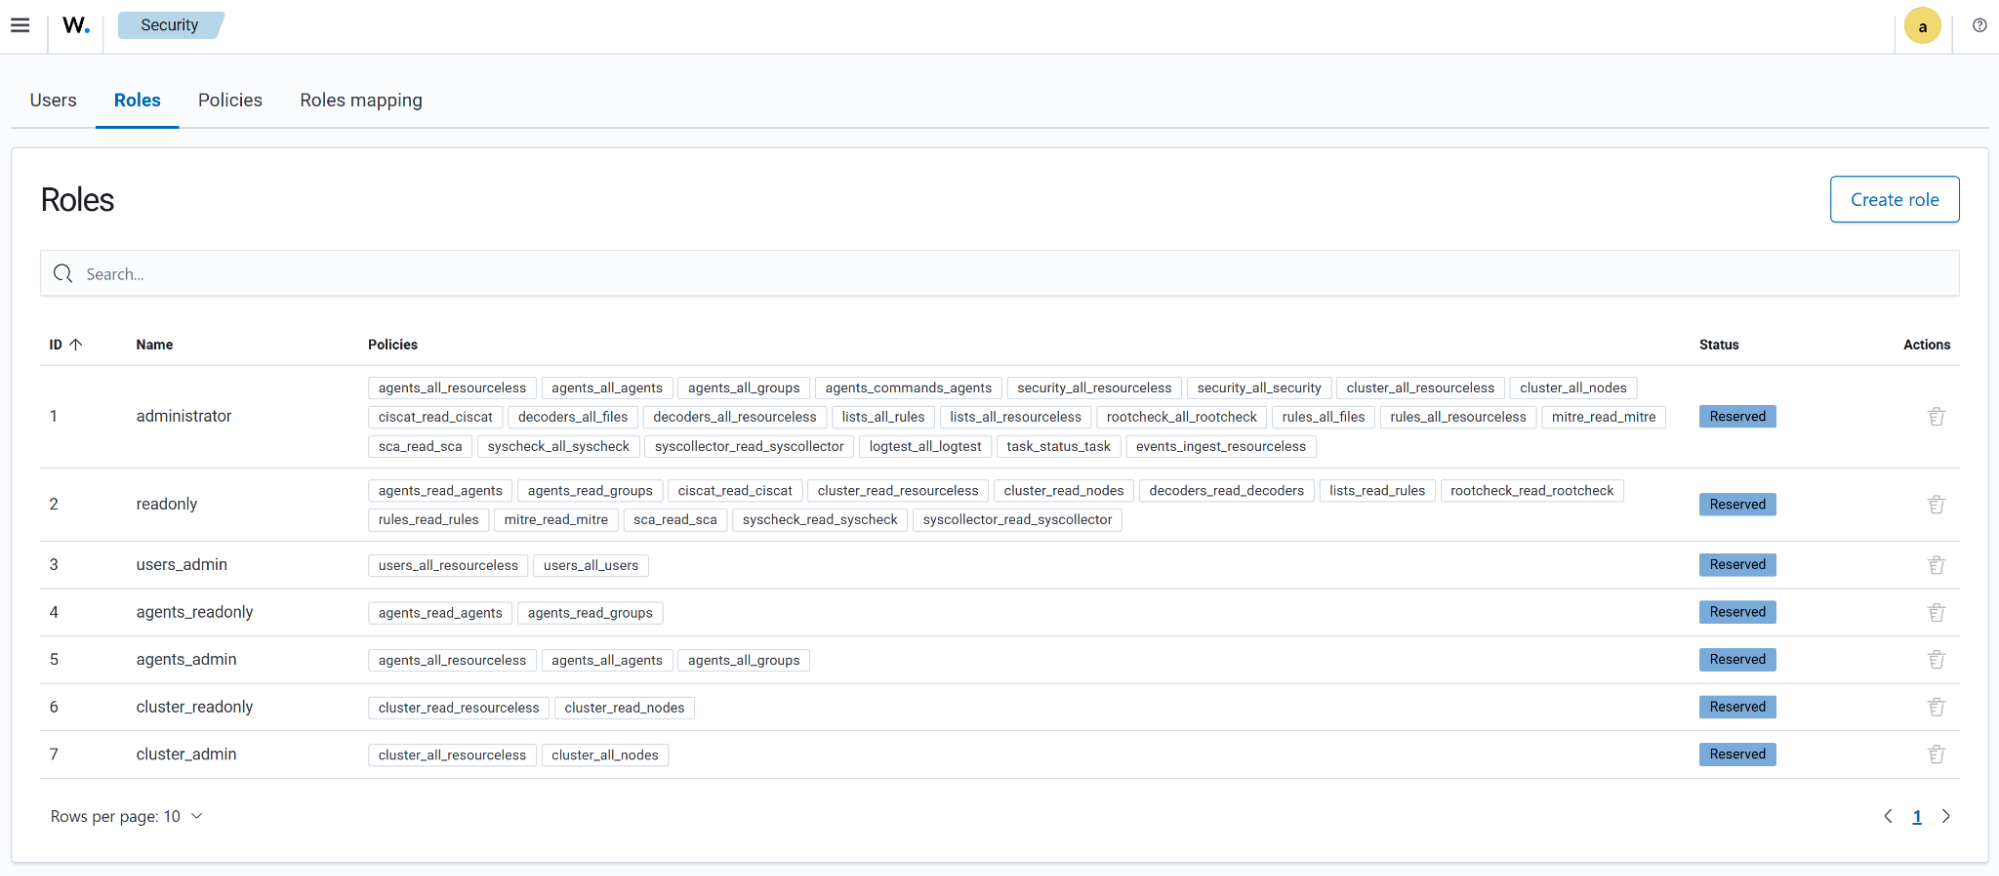
The Roles tab shows the existing roles alongside the Policies assigned to those roles. It also includes the option for creating users.
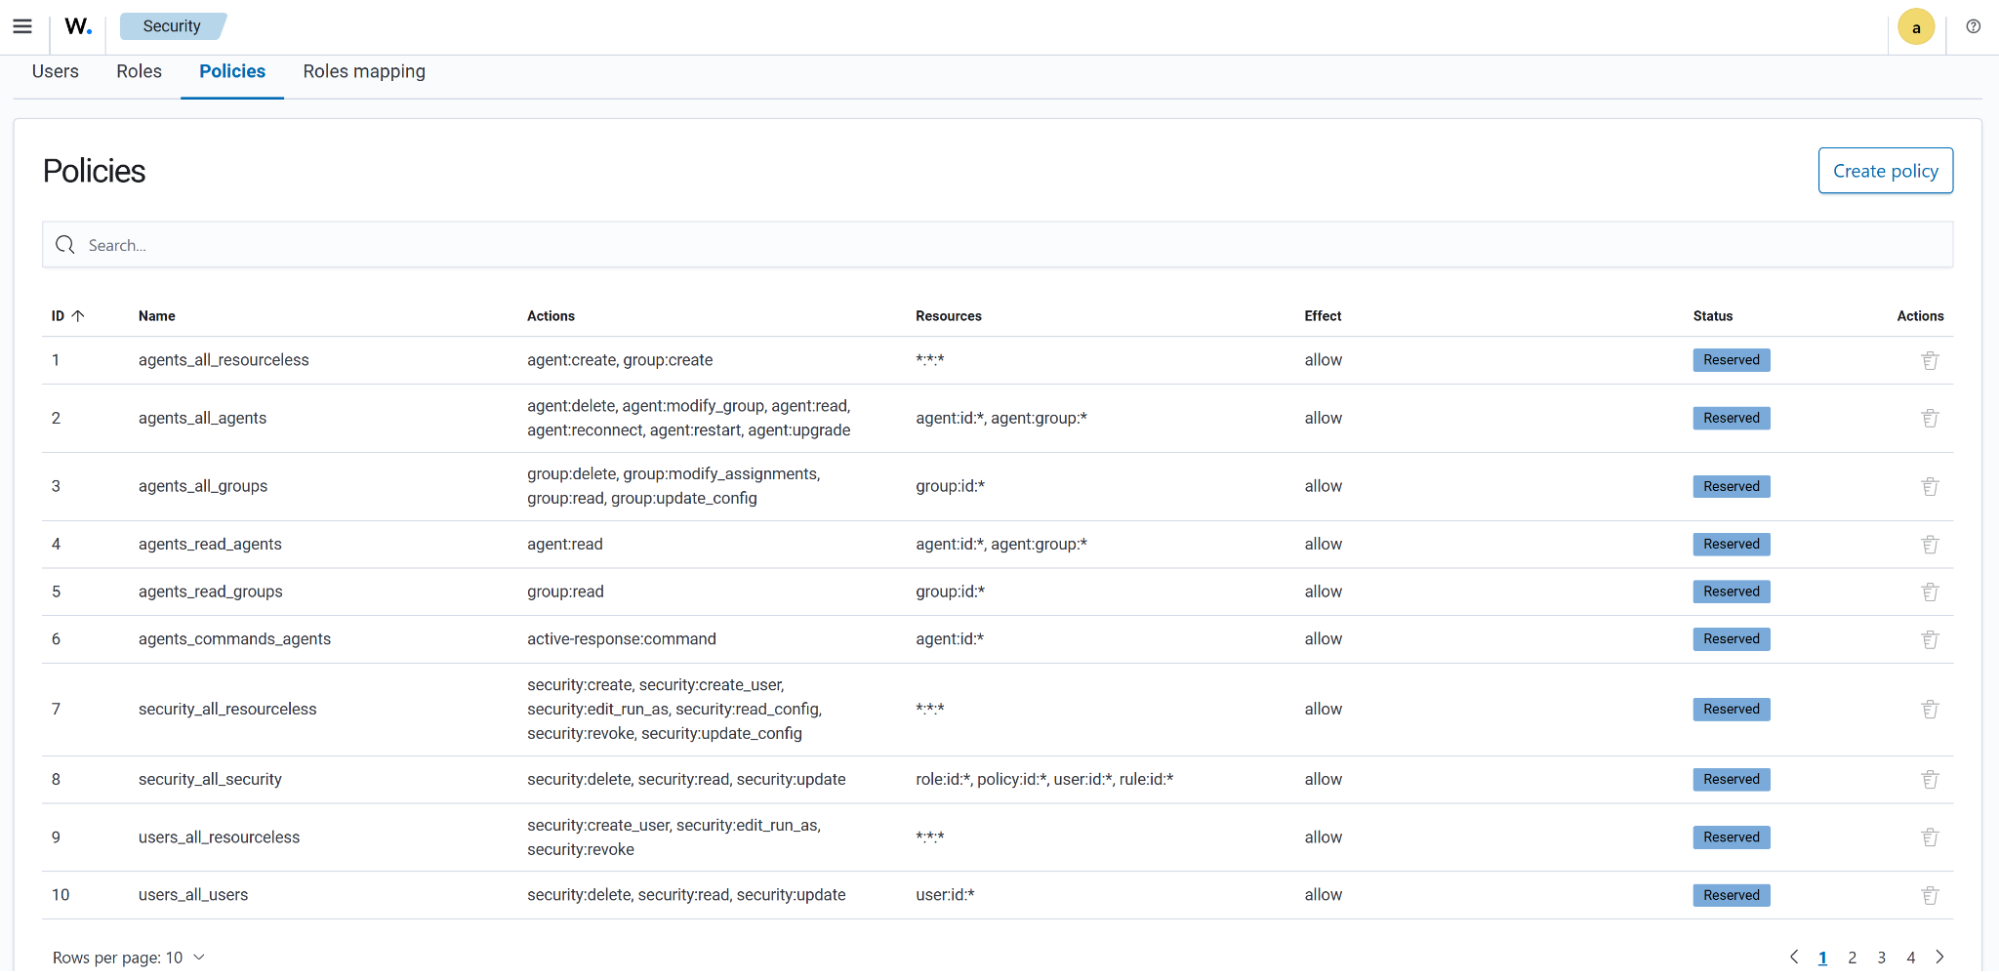
The Policies tab shows the policies that define the actions that can be performed by the internal users. These policies are assigned to Roles.
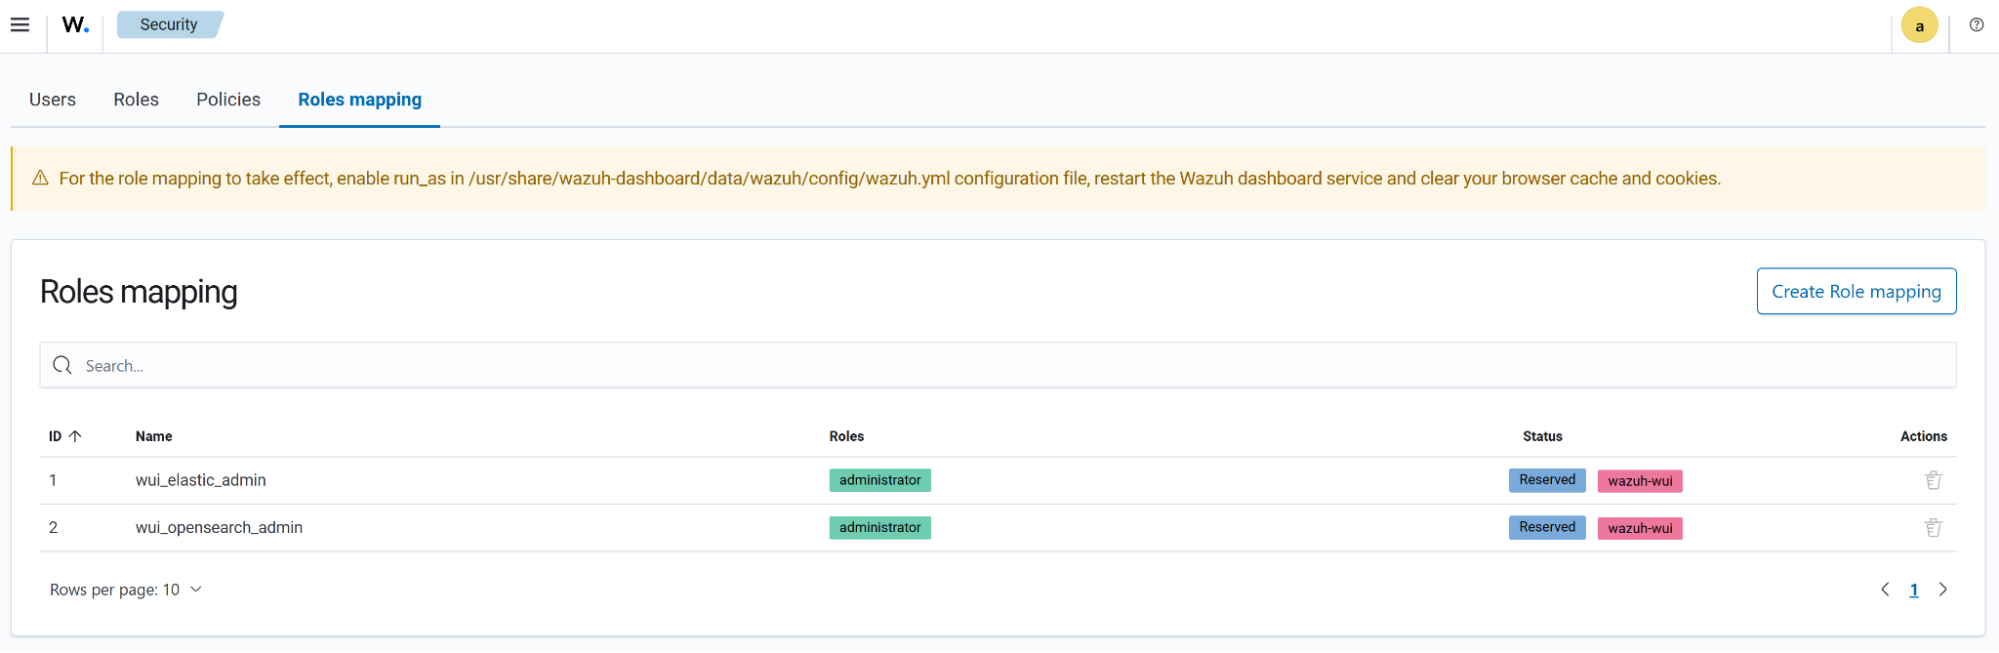
The Roles mapping tab presents users with the option to assign different roles and policies to internal users.
Indexer management
The Wazuh indexer is a real-time, full-text search and analytics engine for security data. Log data ingested into the Wazuh server is analyzed and forwarded to the Wazuh indexer for indexing and storage.

Index and Snapshot Management
The Wazuh indexer management menu provides a graphical user interface for managing your Wazuh indexers, snapshots, and the security of who or what has access to them. Please see the Wazuh indexer documentation to find out more.

Security
This section includes the configuration for access to Wazuh resources based on the roles and permissions assigned to the users. Please see the Wazuh RBAC documentation to find out more.

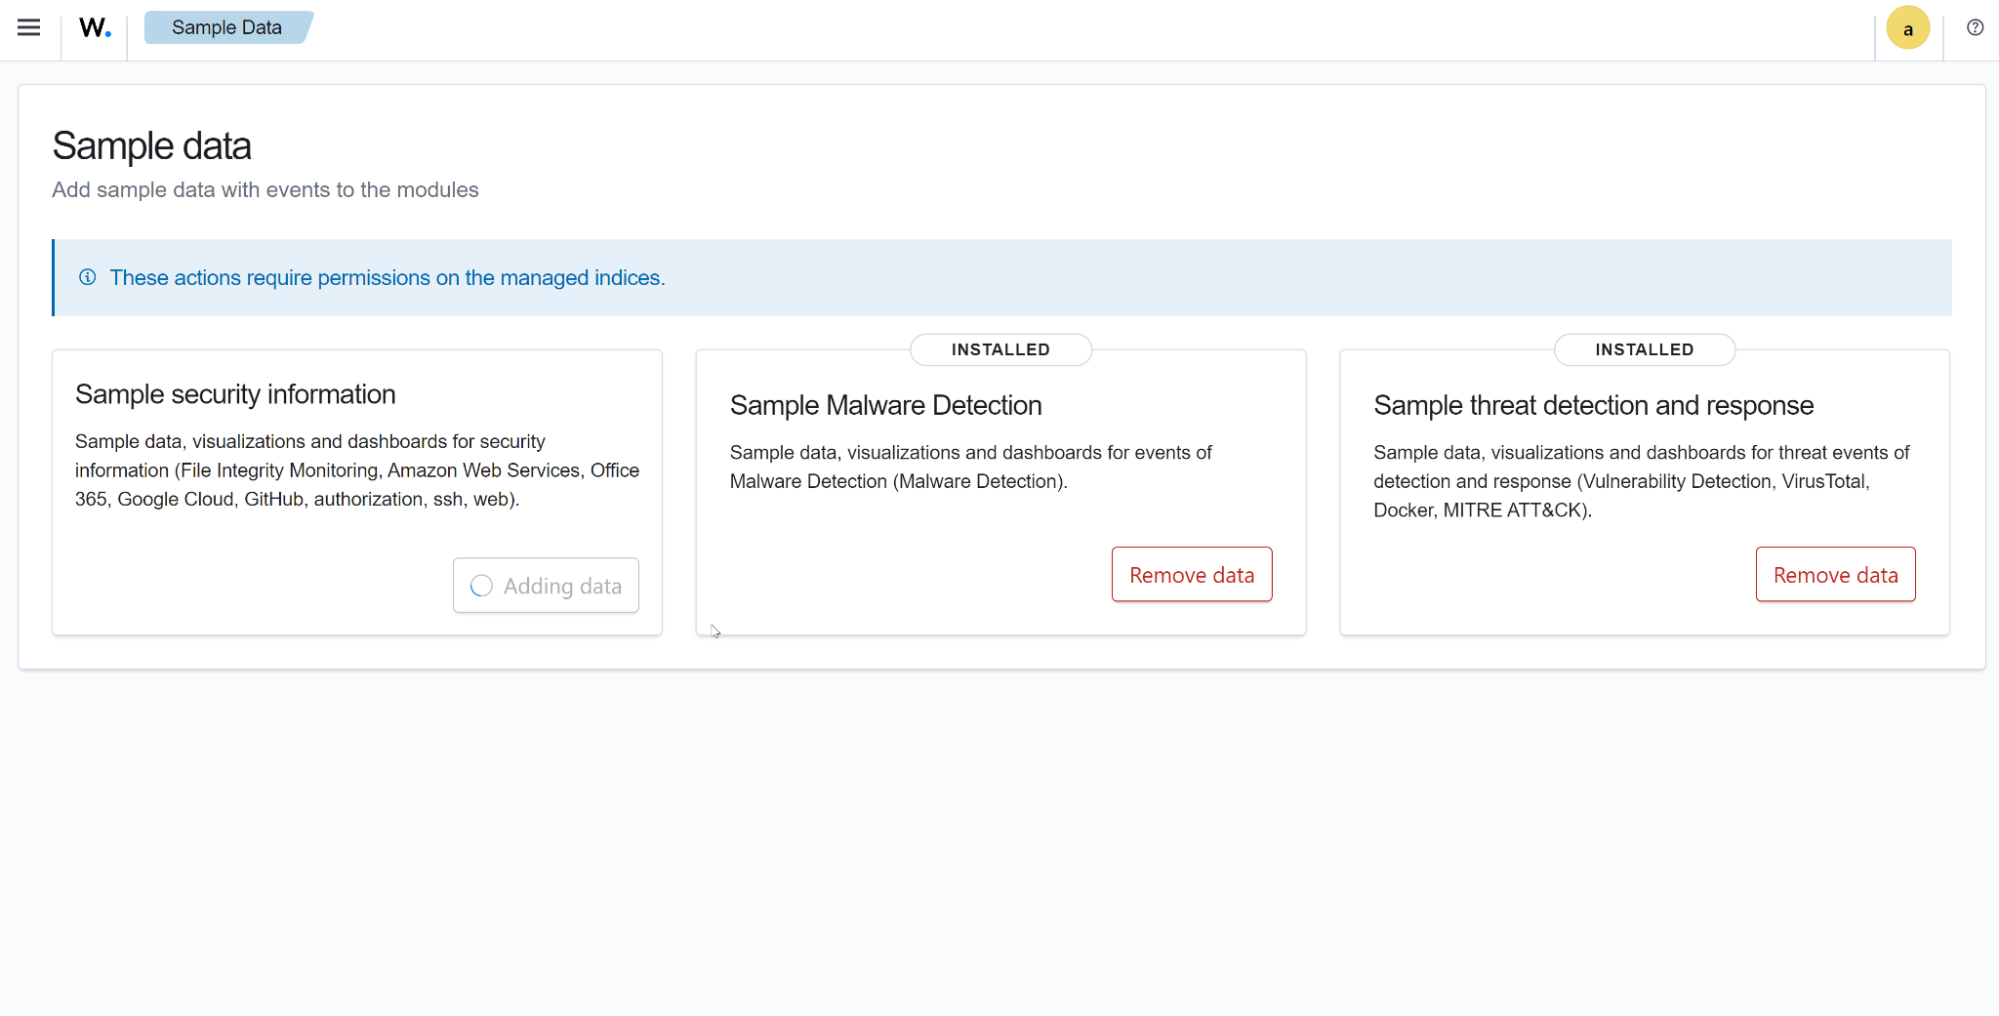
Sample Data
This section gives you the option of adding sample data to any of the listed modules. These data can be seen on the module dashboard, giving you insight into how these modules can be utilized to your benefit.
Dev Tools
This section allows you to make API queries for Wazuh indexer operations, such as cluster management, exploring indexer data, debugging errors, and more.
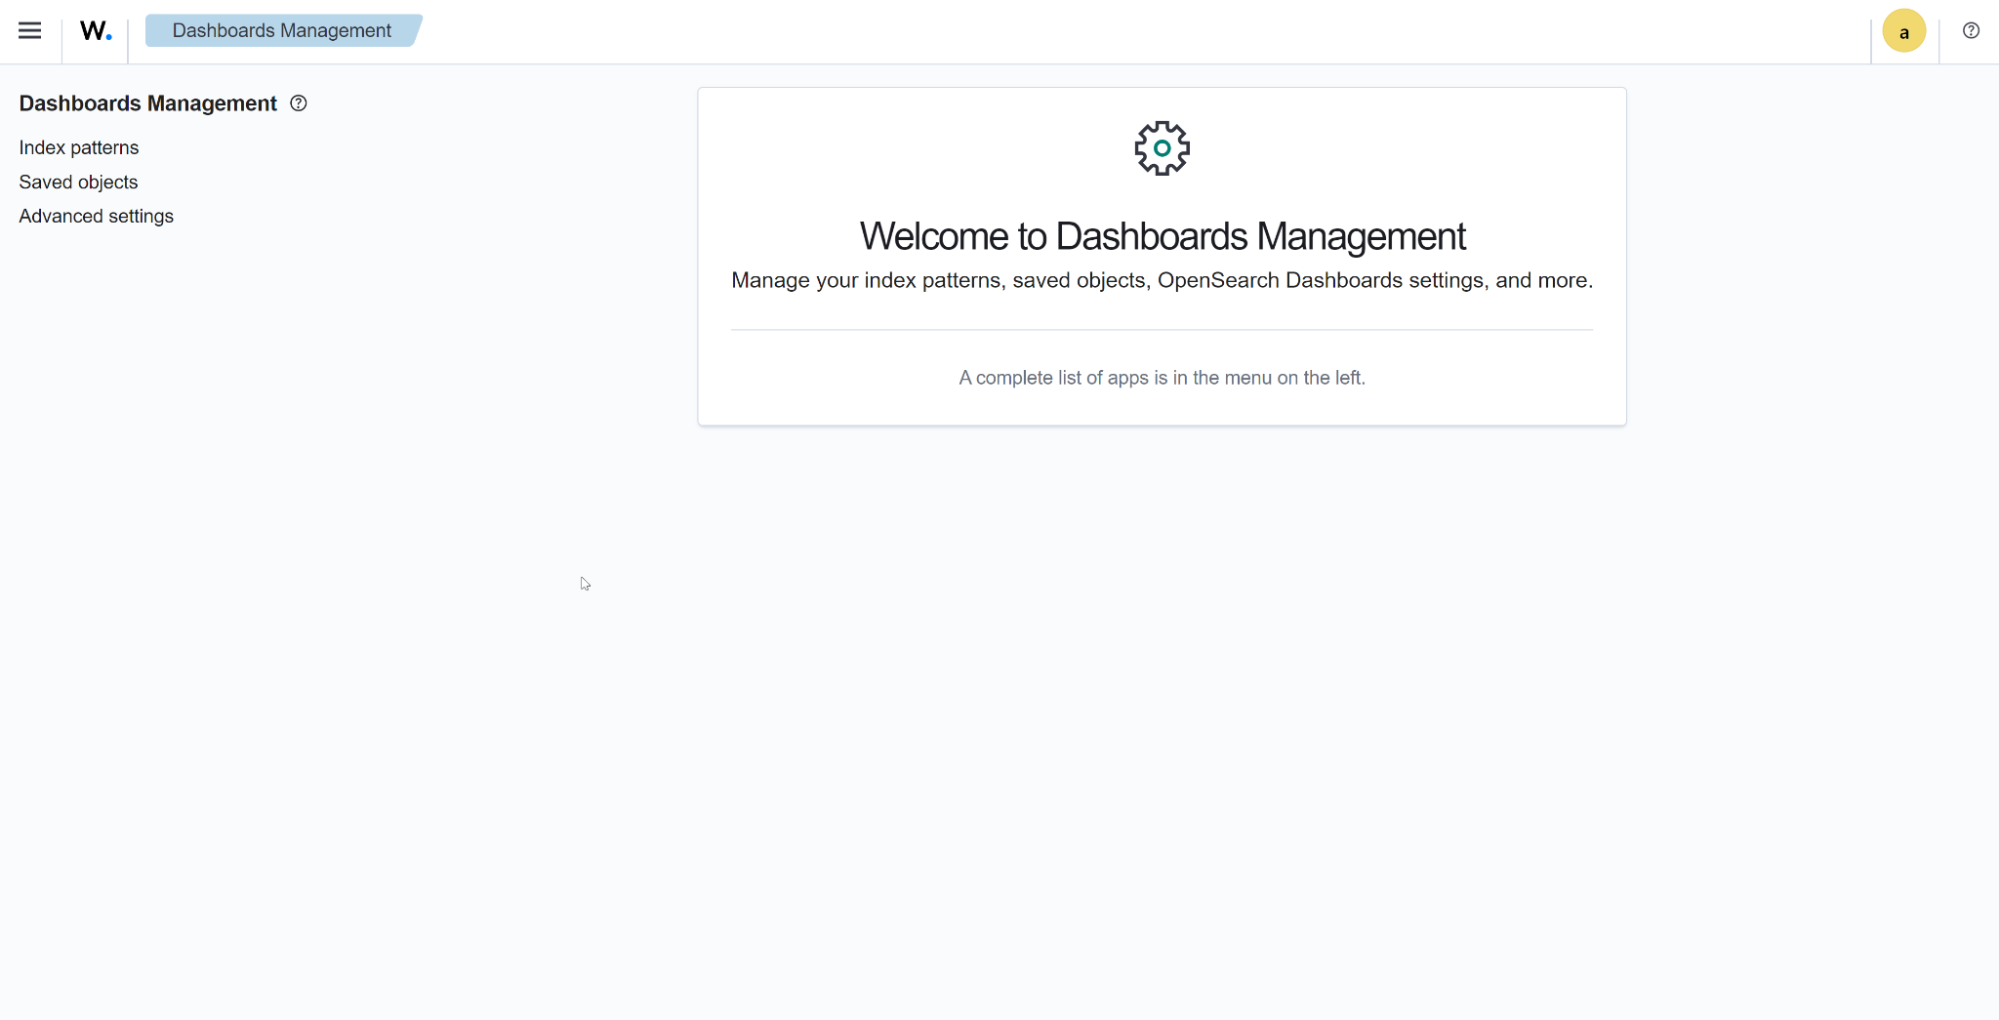
Dashboard management
Dashboard Management
The Wazuh Dashboard Management section includes the options for creating and managing your index patterns and saved objects.
Reporting
The reporting section shows your generated reports.

Server APIs
In this section, you can list all your inserted API credentials. Each entry has multiple available actions to manage it. Remember that a functional API is needed to add or edit an entry. Check your API connection status before adding them to the Wazuh dashboard.
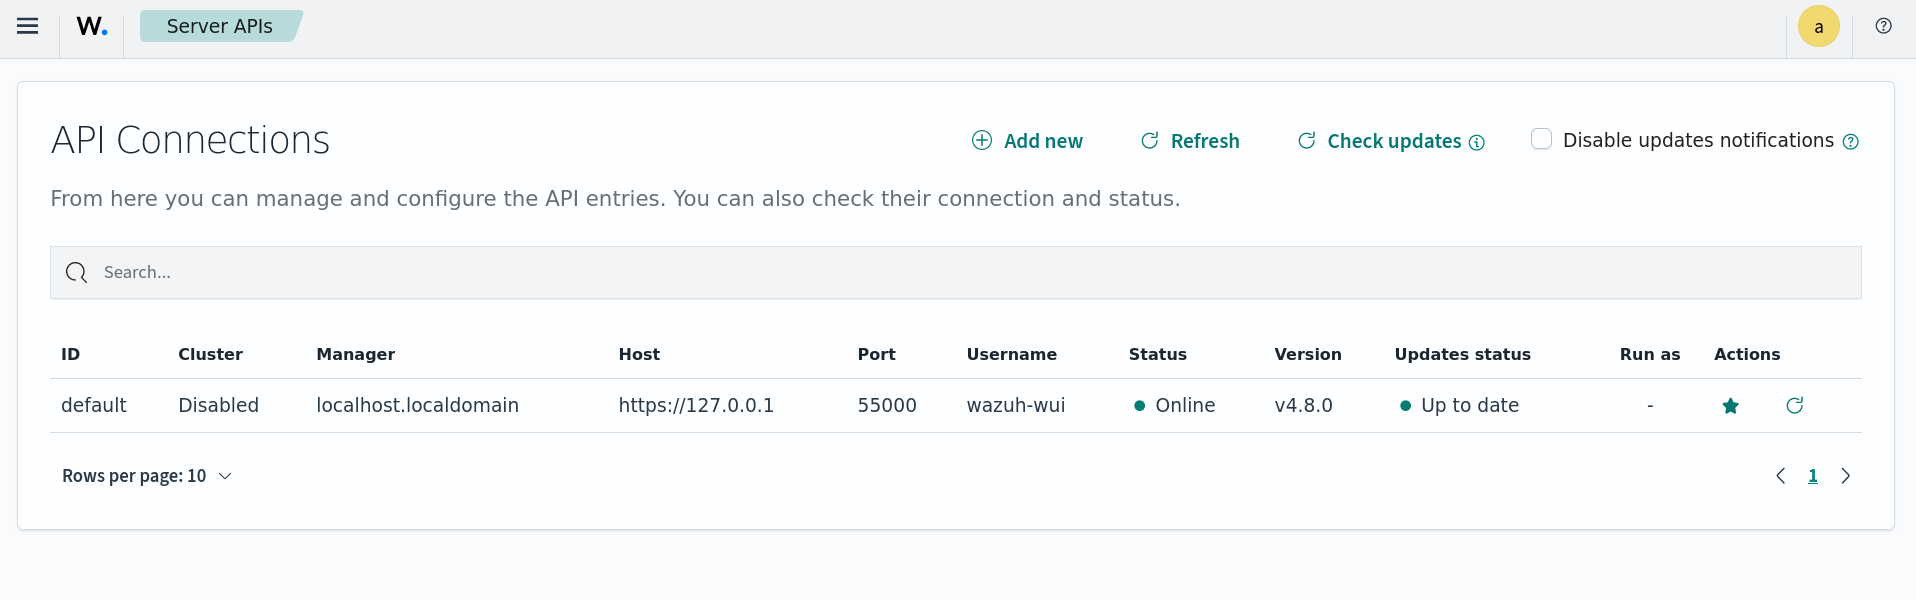
Users can also receive notifications when a new Wazuh update is available, with the option to dismiss these notifications. You can opt out of future alerts by checking the Disable updates notifications option.
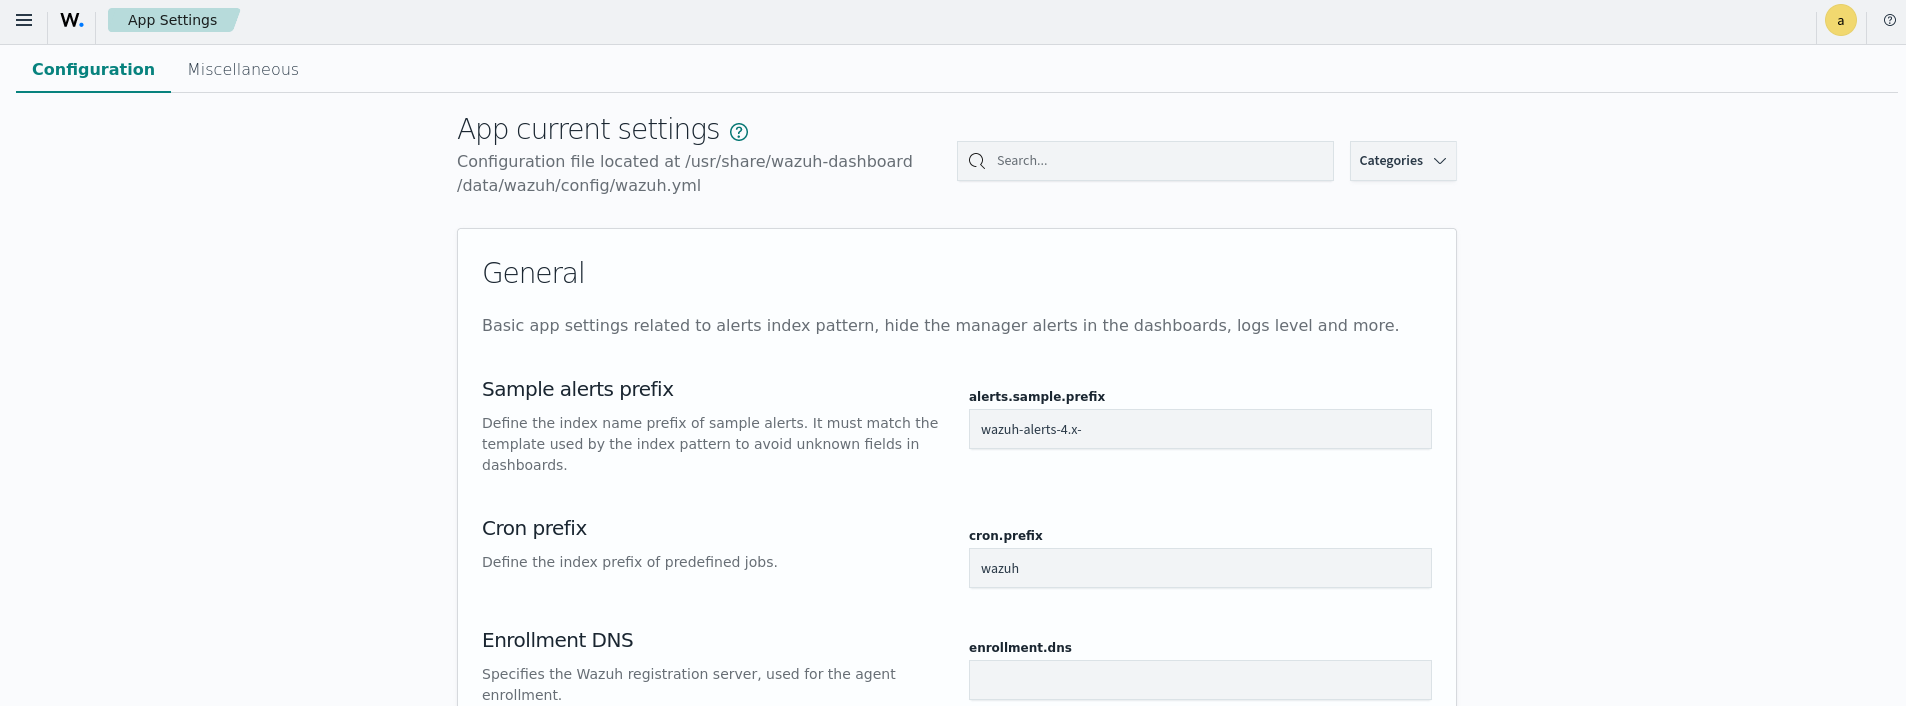
App Settings
The Configuration tab gives a quick look at the Wazuh dashboard configuration file. It also allows the user to modify the Wazuh dashboard settings. The documentation for the /usr/share/wazuh-dashboard/data/wazuh/config/wazuh.yml file can be found in the Wazuh dashboard settings section.
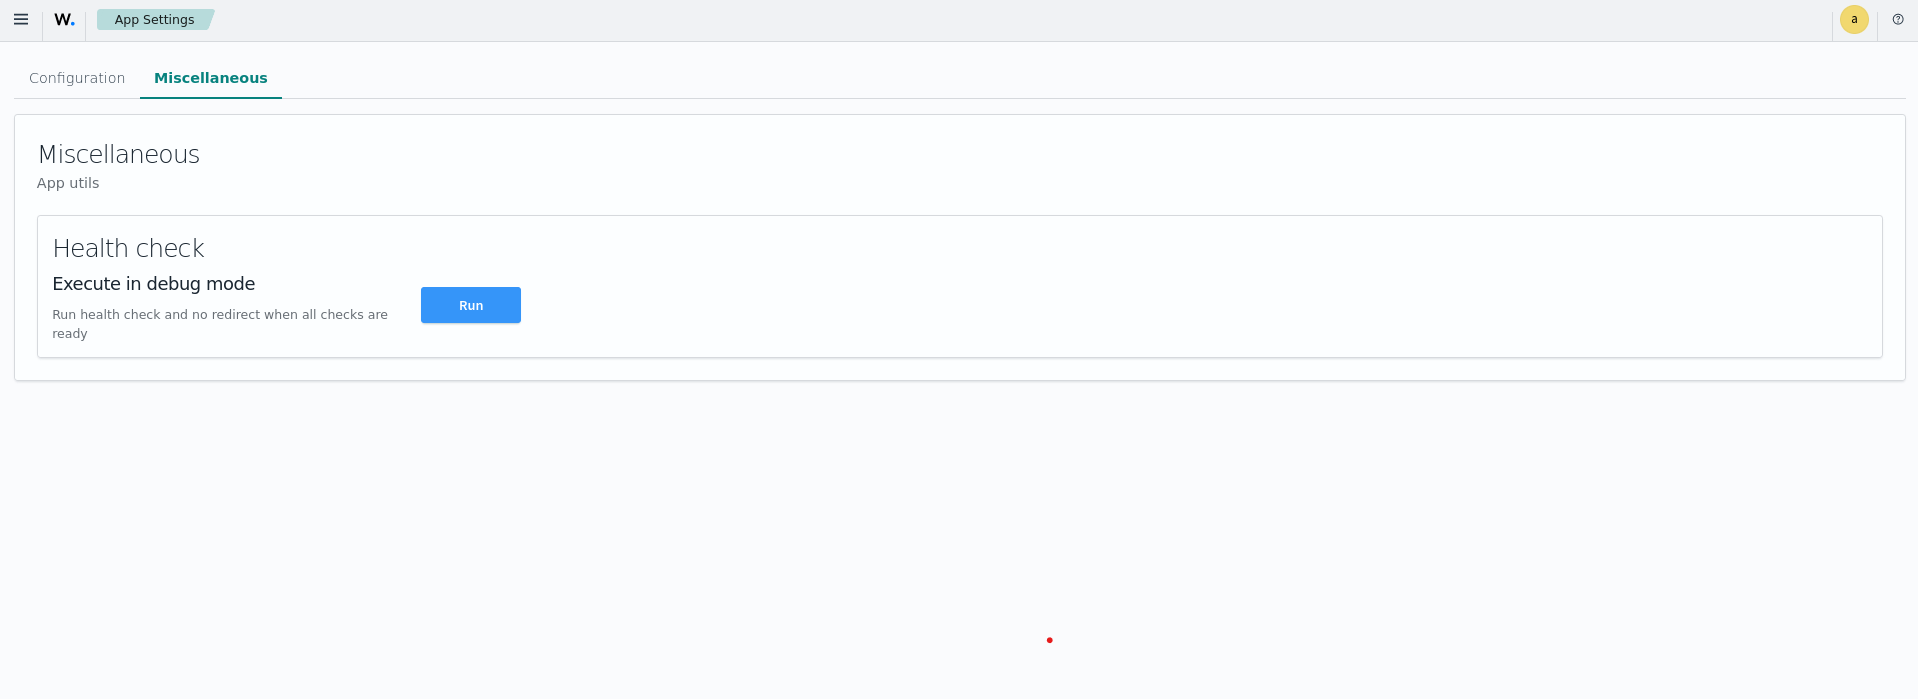
From the Miscellaneous tab, you can run a health check on the Wazuh components.
About
This section provides information about your currently installed Wazuh dashboard package, such as version, revision, and installation date. If you want to discover what’s new on each release, you can go to our Changelog file to check it out.
